Why global markets haven’t seen their troughs yet?

The Chinese culture says that one picture is worth a thousand words, and the exhibition below from the analysis of Goldman Sachs shows us all the drops in the U.S market, as well as their comebacks.
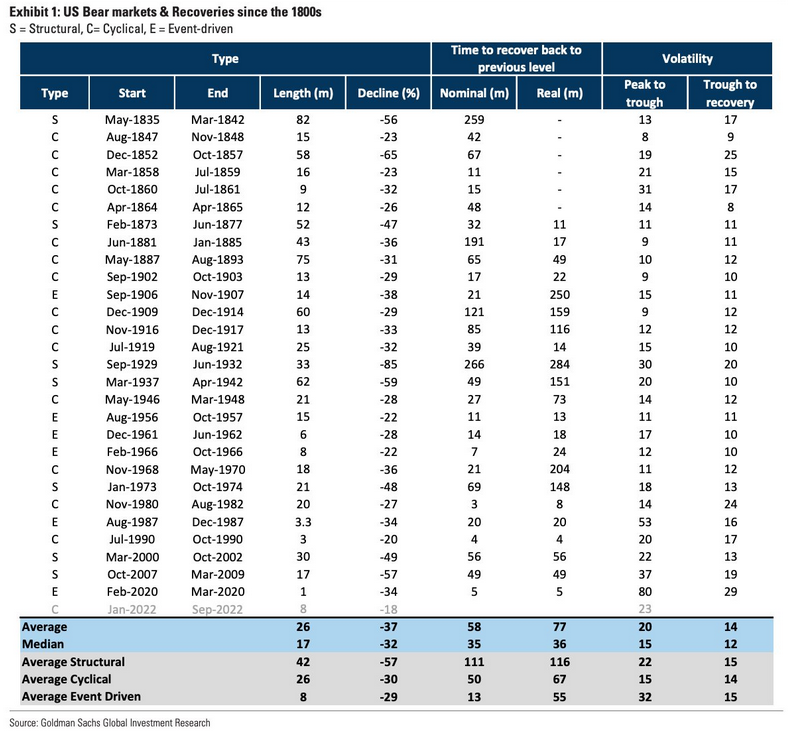
Source: Goldman Sachs
First of all, they divide the Bear Markets into Structural, Cyclical, and Event-driven declines. As you can see, the recent Structural ones were in 2000 – 2002 (dot.com crisis) and 2007-2009 (Lehman Brothers crisis). An Event-driven bear market took place in 2020 for only one and a half months. The way they label the corrections of the market is right, because in the first 2 examples, the fault came from the structural policy of the stock exchanges and the supporting money supply through the banking-loan system respectively, and the third example came from the event of the virus COVID-19, which in turn spread fear for the humanity.
That said, let’s see if we are supporting the argument they depicted for the nowadays correction as a Cyclical one, with only 8 months duration till now. The most recent Cyclical decline was in 1990 (only 3 months), where after the month of June and the unemployment rate at 5,2%, and the all-time highs for DOW30 at 2900 points, President Bush decides to turn the lights into threatening Iraq with an embargo and an inevitable war, and last but not least, he broke his promise about not raising taxes. After a month, the U.S entered into a recession and till the end of the year, the unemployment rate was at 6,3%.
In my opinion, these facts are not considered Cyclical, but since they come from decisions of higher officials, such as the President of the USA, should be considered Structural. So as be for the declines. Hence, for me, we have a Structural Bear Market which came from the monetary policy of the overheating M2(money supply through the Federal Reserve buying senior bonds) for over a decade.
But the article aims to prove whether we have a Structural/Cyclical or an Event-driven decline, the reasons for not having seen the trough yet. The 3 reasons are:
-
The transition from a bear market to a bull market tends to be strong and driven by the expansion of valuations, regardless of the type of bear market. Here, we have a good picture of the giants, like Apple, Tesla, etc., but the overall economic conditions and valuations are poor and strongly declined.
-
Sentiment-based Risk Appetite Indicator and Fundamentals-based Bull/Bear Indicator, (GSRAII) and (GSBLBR) respectively, help identify potential turning points. When both indicators come to an end/edge provide strong signals.
-
Approaching the worst point of the business cycle, peaking inflation and interest rates and negative positioning are also important to recognize the turning point.
Also, as you can observe in the picture, the average for a Structural/Cyclical Bear Market is between 26-42 months and the recovery takes between 50 -111 months. As much as double the correction phase. Therefore, because we eliminate the Event-driven one, since we are in the middle of an uncertain result of the Russia – Ukraine war, persistent inflation caused by the high prices of energy (crude/brent oil and natural gas), and the lack of supply affecting the commodities (corn, wheat), the upcoming global recession is inevitable and the one that we do not know yet is the depth.
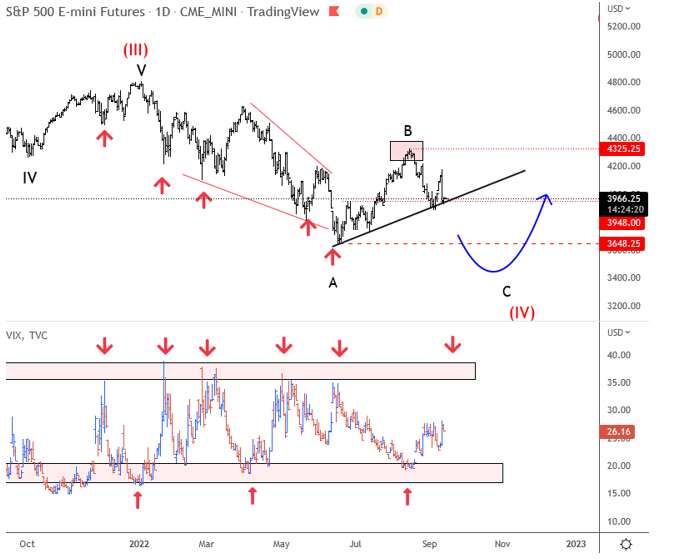
With that being said, we believe that stocks are trapped in a higher degree consolidation. On SP500 we are observing two ideas for wave (IV). The first and primary count shows room for wave C to retest the 2022 lows. VIX known as a fear index also suggests that fear is not at the extreme yet, meaning that there is room till we see more pessimism, which should reach extreme readings before we may finally see a bottom. Unfortunately, that’s how market and crowd behavior works.
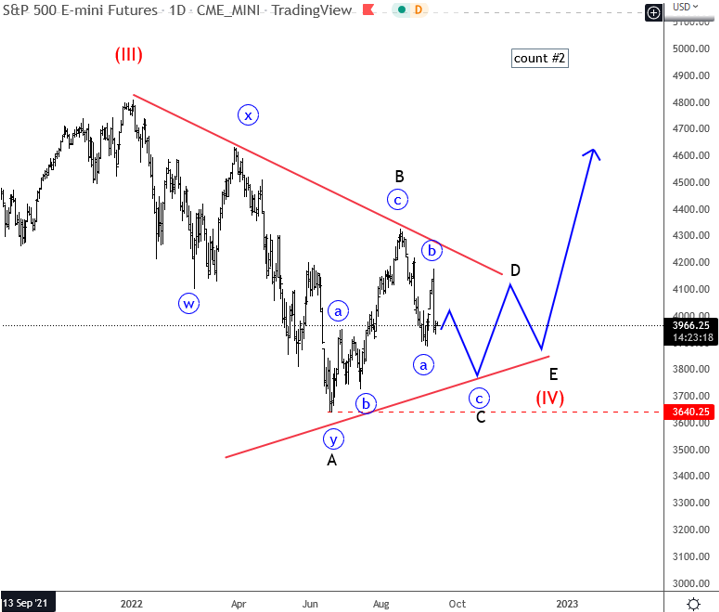
If price would stay sideways for a longer-period in this 48099 3659 reange than triangle is also one valid scenario, but even this one is incomplete. So it appears that based on two counts there can be more volatile moves by the end of the year.
Get Full Access To Our Premium Analysis For 14 Days. Click here!
Get Full Access To Our Premium Elliott Wave Analysis For 14 Days. Click here.
Author

Gregor Horvat
Wavetraders
Experience Grega is based in Slovenia and has been in the Forex market since 2003.