Crypto trades through a confidence reset as ETF flows, liquidity gaps and realized losses shape price action

The cryptocurrency market is navigating a liquidity-driven reset rather than a narrative-driven rally. Bitcoin (BTC), Ethereum (ETH) and major altcoins remain under pressure even as new exchange-traded fund (ETF) filings continue and selected inflow days appear on the tape.
Recent headlines highlight the divergence. ETF issuers are pressing ahead with new crypto products, including leveraged Bitcoin and Ether strategies and altcoin-linked funds. At the same time, investors have withdrawn billions from US-listed Bitcoin and Ether ETFs over the past several months, and many spot ETF buyers are sitting on average paper losses.
Price is reacting more to realized flows and liquidity conditions than to product announcements.
What is driving the recent move?
Several catalysts have converged:
1. ETF redemptions and uneven inflows
While individual sessions have recorded positive net Bitcoin ETF inflows, the broader trend since the October peak has included meaningful redemptions. Bloomberg data shows more than $3.5 billion withdrawn from Bitcoin ETFs and over $1.5 billion from Ether-focused products in recent months.
This dynamic creates an important tension: product expansion signals long-term infrastructure buildout, but short-term price is more sensitive to realized net flows than to filings.
2. Liquidity clustering in US trading hours
Bitcoin continues to trade 24/7, but liquidity increasingly concentrates during US weekday hours. Data referenced in recent reporting shows that weekend depth deteriorates and transaction costs widen, increasing the probability of sharp, thinly traded moves.
This has contributed to a pattern where weekend or overnight breaks overshoot key levels, followed by partial retracements during higher-liquidity sessions.
3. Macro repricing and rate expectations
After a stronger-than-expected US jobs report, rate-cut expectations were pushed further out. Bitcoin has diverged from equities in this phase, falling even as US indices held firm. That divergence suggests crypto is being repriced independently as a higher-volatility risk pocket rather than as a simple Nasdaq proxy.
On-chain signals: loss realization dominates
Recent on-chain analytics reinforce the stress narrative.
Bitcoin
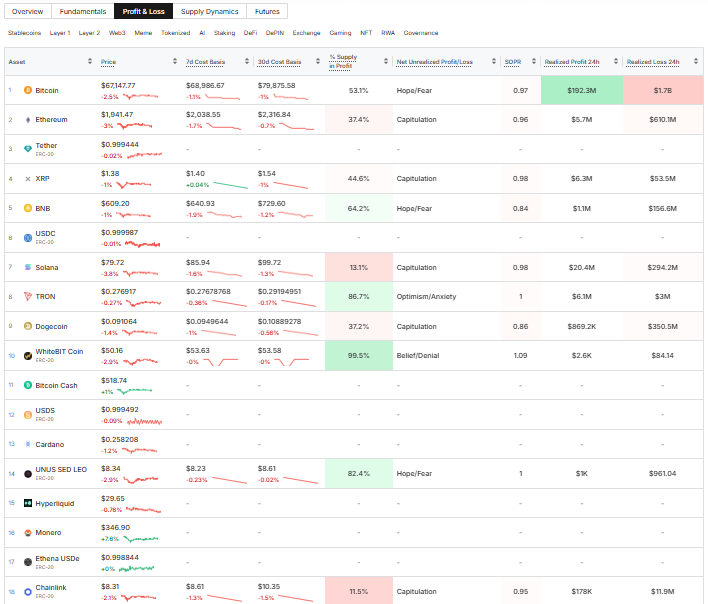
- Price: near $67,000
- Supply in profit: roughly 53%
- SOPR: below 1 (around 0.97)
- Realized losses significantly exceed realized gains on a 24-hour basis
A SOPR reading below 1 indicates that, on average, coins are being spent at a loss. When paired with heavy realized losses, this typically reflects capitulation-type behavior rather than expansionary demand.
Source: Glassnode Studio
Notably, ETF net flow data shows select positive daily inflows. However, price has struggled to sustain upward momentum, suggesting that inflows have not been sufficient to offset broader spot selling and deleveraging.
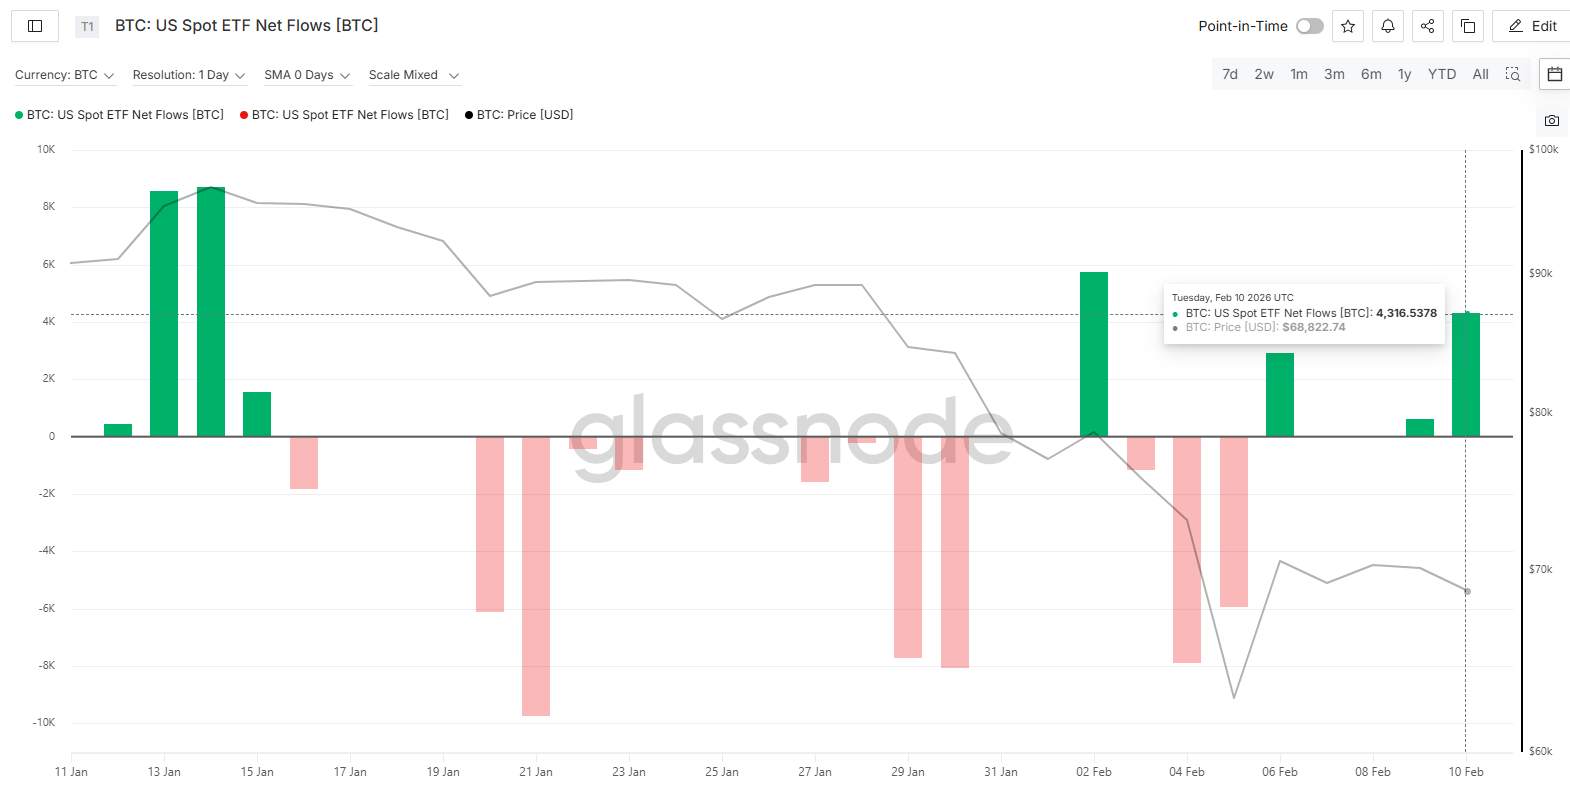
Source: Glassnode Studio
Ethereum
- Price: near $1,940
- Supply in profit: approximately 37%
- SOPR: below 1
- NUPL classification: capitulation
Source: Glassnode Studio | Screenshot above
Ethereum’s lower supply-in-profit ratio relative to Bitcoin indicates deeper drawdown stress. Realized losses remain elevated, and price structure reflects continued distribution into rebounds.
This aligns with broader commentary questioning core narratives for Ether, including treasury-style accumulation models and valuation support from network usage.
Bitcoin vs Ethereum vs altcoins: correlation with beta differences
Bitcoin remains the primary liquidity benchmark in crypto markets. Ethereum trades with higher beta due to its dual role as both a macro-sensitive asset and infrastructure layer for decentralized applications.
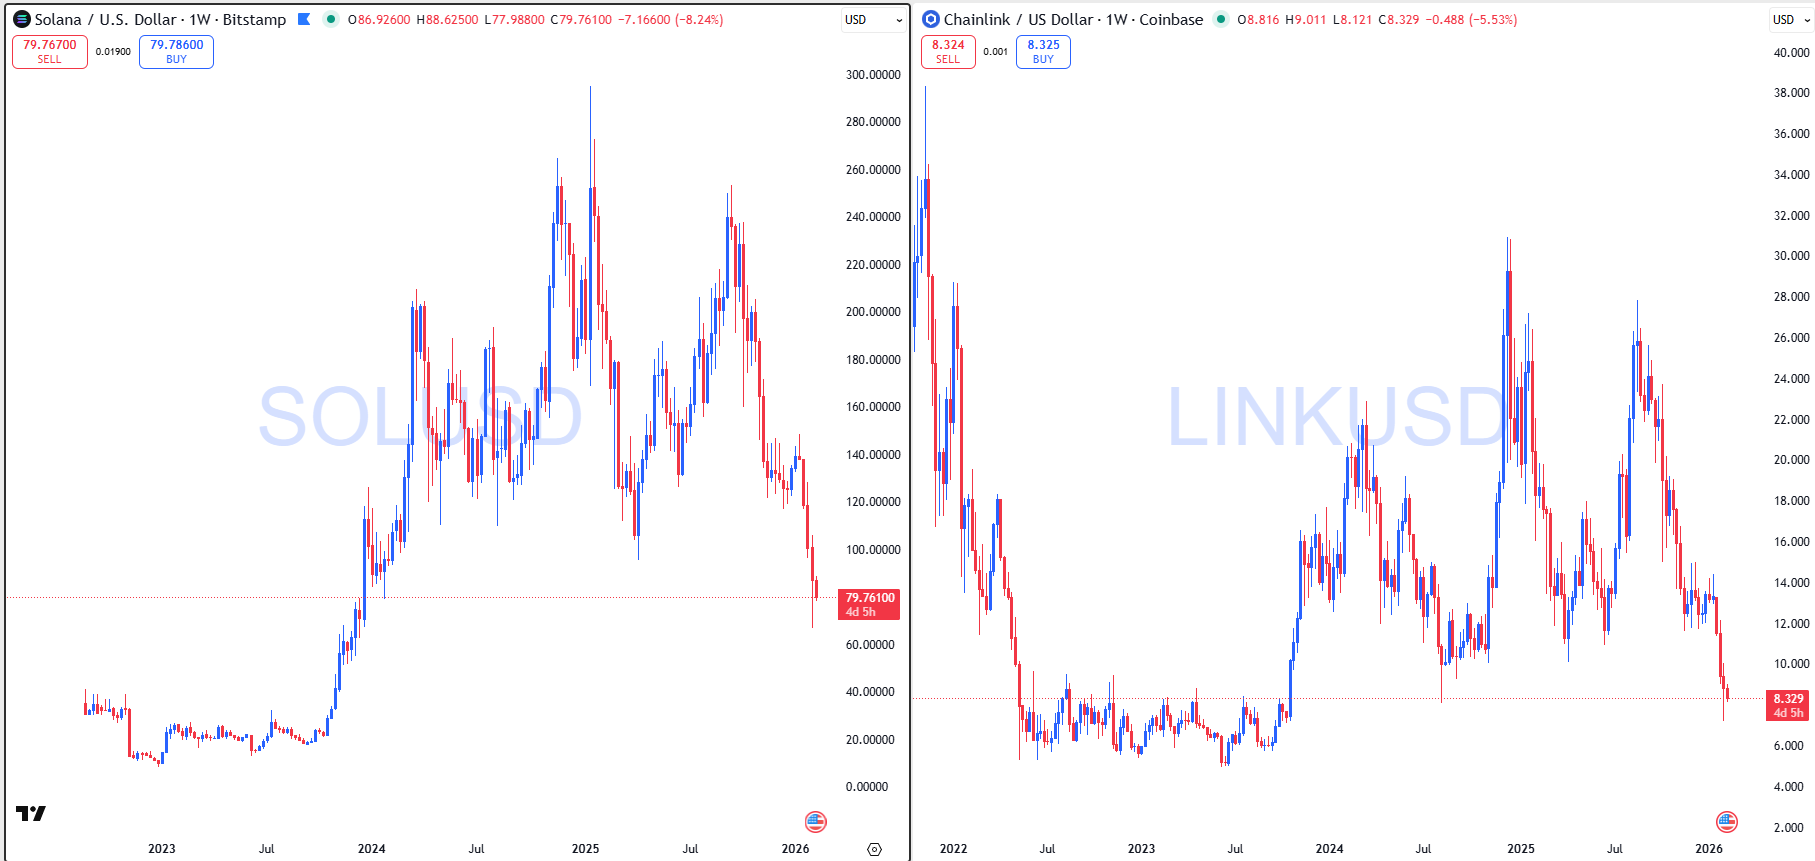
Altcoins such as XRP, Solana (SOL), Cardano (ADA) and Chainlink (LINK) exhibit even greater sensitivity to liquidity and sentiment shifts.
On-chain snapshots show:
- SOL supply in profit near low double digits, consistent with capitulation labeling
- LINK supply in profit similarly depressed
- XRP with relatively higher supply in profit but still under technical pressure
- Multiple large-cap tokens trading with SOPR below 1
This configuration suggests that rallies in altcoins require both Bitcoin stability and broader improvement in liquidity conditions. In the absence of those factors, altcoins tend to underperform during risk-off phases.
Whales vs retail: what the data implies
Without speculating on individual positioning, the observable metrics suggest:
- Heavy realized losses indicate weaker hands are exiting at lower prices.
- SOPR below 1 across several majors reflects continued loss realization.
- ETF infrastructure expansion continues despite outflows, indicating that longer-term capital remains structurally engaged but price-sensitive.
Market structure resembles an inventory transfer phase rather than broad risk re-entry.
Current price structure and technical context
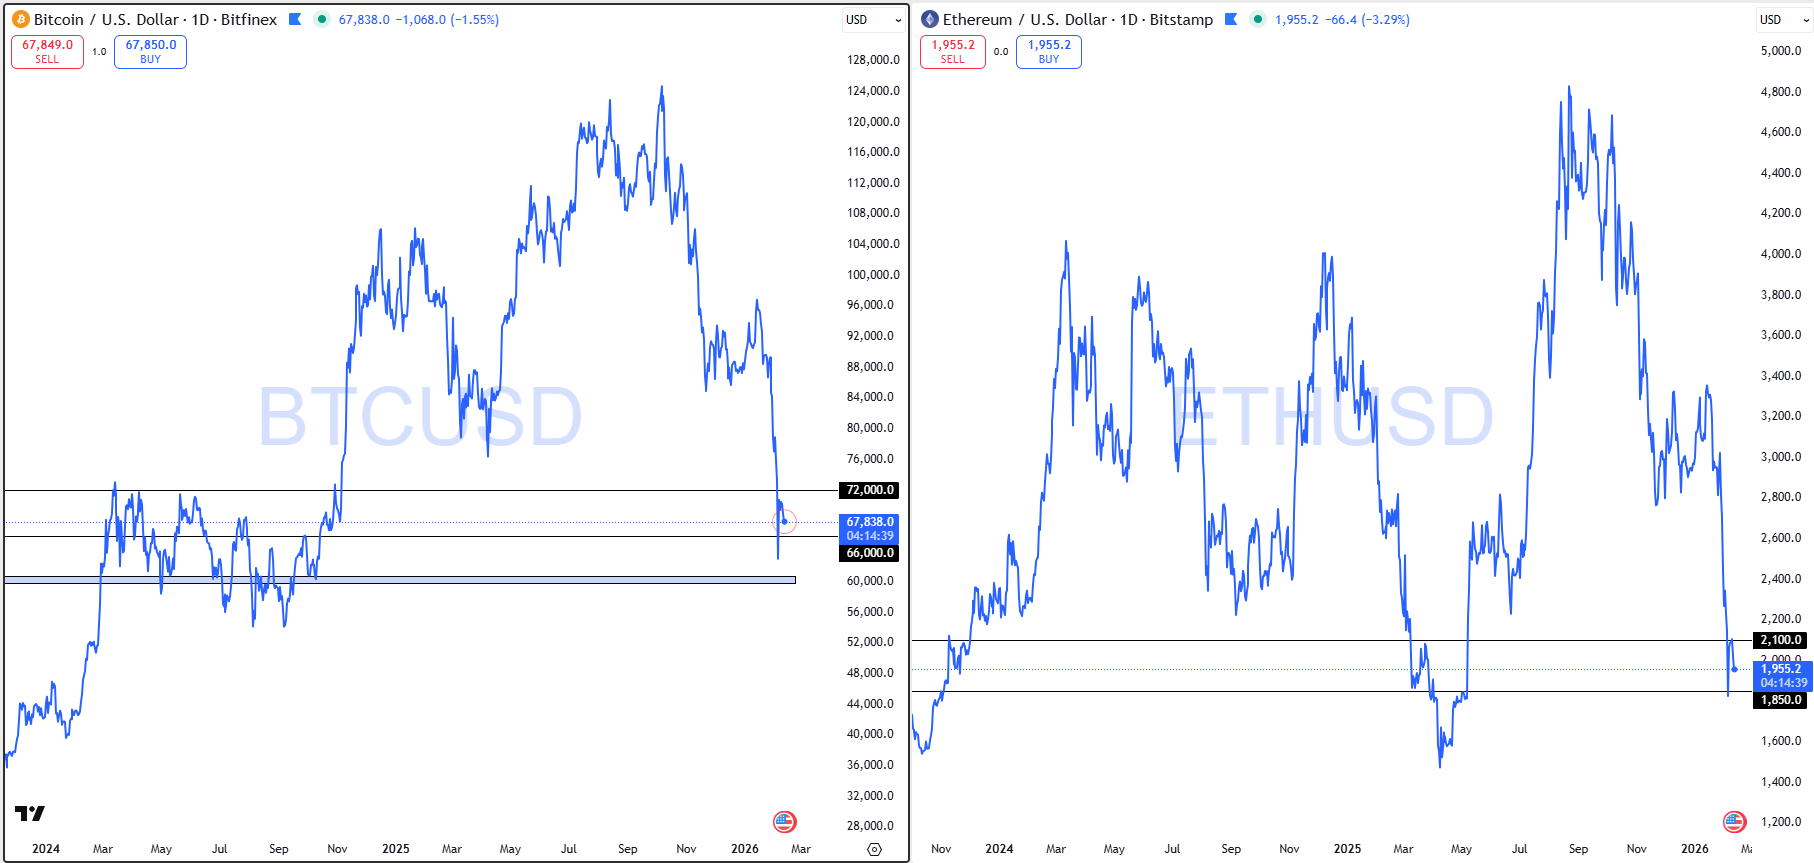
Bitcoin is consolidating near the $66,000–$68,000 region after testing deeper levels during recent selloffs. Resistance remains near $70,000–$72,000, where prior rallies have stalled. Support sits near the mid-$60,000 zone, with further downside exposure toward the low-$60,000 region if that band fails.
Ethereum is trading below major moving averages, with overhead resistance around $2,000–$2,100. Sustained acceptance above those levels would be required to shift short-term momentum. Below current levels, $1,850–$1,900 remains a key support cluster.
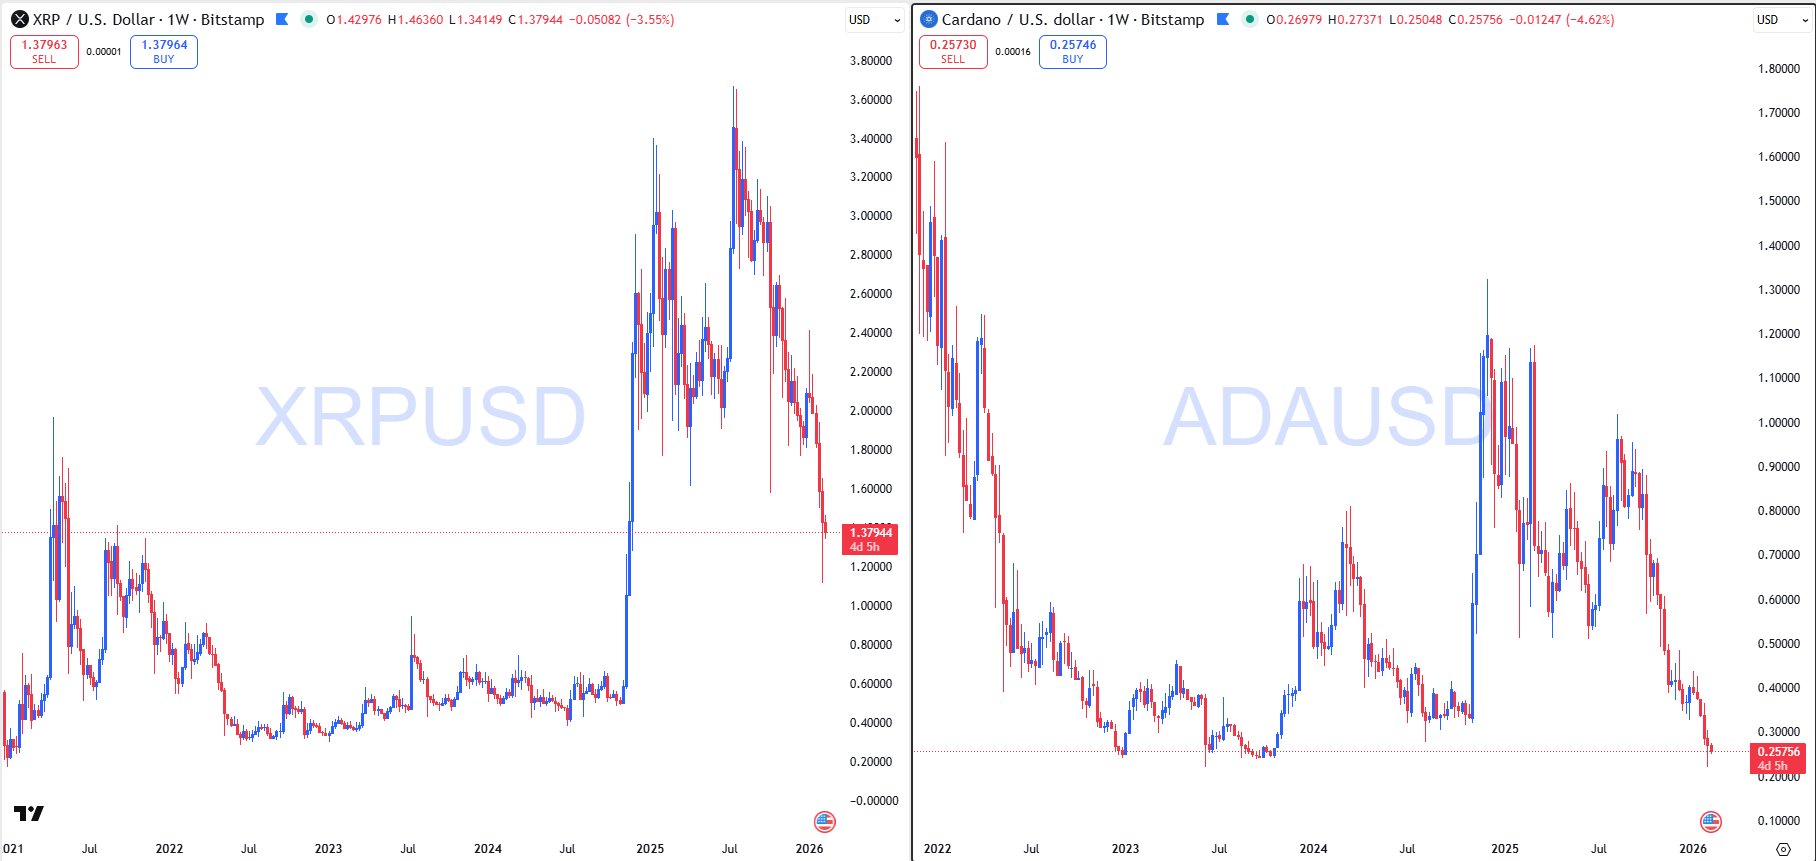
XRP, SOL, ADA and LINK all show broken range structures on higher time frames. Momentum indicators across several tokens remain in sub-neutral territory, and rallies have repeatedly failed near prior support-turned-resistance zones.
Common positioning errors in the current regime
- Treating headline spikes as confirmed trend reversals.
- Interpreting single capitulation candles as durable bottoms.
- Assuming Bitcoin stabilization automatically translates into altcoin outperformance.
- Overlooking liquidity differences between US sessions and weekend trading.
Volatility is elevated, and thin order books increase the probability of exaggerated moves once key levels give way.
Investor vs trader behavior in this environment
Longer-horizon participants typically monitor structural metrics such as supply-in-profit stabilization, cooling realized losses and sustained ETF inflow trends before reassessing exposure.
Shorter-term traders focus more on level-to-level price acceptance, confirmation after breakouts, and liquidity timing. In the current tape, follow-through during high-liquidity sessions has carried more weight than initial breaks during thin hours.
Conclusion
Crypto markets are undergoing a confidence reset shaped by liquidity concentration, ETF flow dynamics and persistent loss realization. Infrastructure continues to expand, but price remains sensitive to realized positioning and macro repricing.
Until on-chain stress metrics stabilize and flows show sustained net absorption, volatility is likely to remain elevated across Bitcoin, Ethereum and major altcoins.
Author

Vrajeshwari Bhardwaj
SharmaFX
Vrajeshwari Bhardwaj is the founder of SharmaFX, a global trading education and mentorship platform built on an institutional approach to forex, indices, commodities, and crypto markets.