Where's the Yield Tipping Point?

One key metric I'm watching is the extent to which bond yields have risen relative to equity indices. The chart shows the SP500 / 10-year yield ratio falling to its lowest level since March 2017.
Stocks Threatened by Bonds
In last week’s piece, I asked if rising bond yields could threaten gold prices. Today’s question asks whether the rise in bond yields will endanger equity indices. As I write this, US equity indices are finally posting declines of more than 5-7% from their peaks, something not seen since autumn 2015 when equity markets feared uncertainty ahead of the US presidential elections.
Unlike the major selloffs in indices of the past 2 years — which were mostly caused by worries about a China slowdown, the current market decline is the manifestation of prolonged selloff in bond markets (tumbling prices and sharp ascent in yields). The fear that rising bond yields in and out of the US will endanger companies’ future profitability as well as sovereign’s budget deficits.
Fundamental Arguments
We could engage in a long fundamental discussions as to whether the 45% increase in US 10 year bond yields of the past five months to its highest level in four years (2.83%) will introduce a considerably higher risk premium to stocks valuation. Some could argue that depends on sectors, size of companies’ capitalisation, profitability and cash balances.
Others will indicate that 3.00% on the US 10-year yields is the more relevant level to watch because it presents a threat to the level of GDP growth as well as its role as a crucial technical level on the price charts.
Bond Yields Relative to Equity Indices
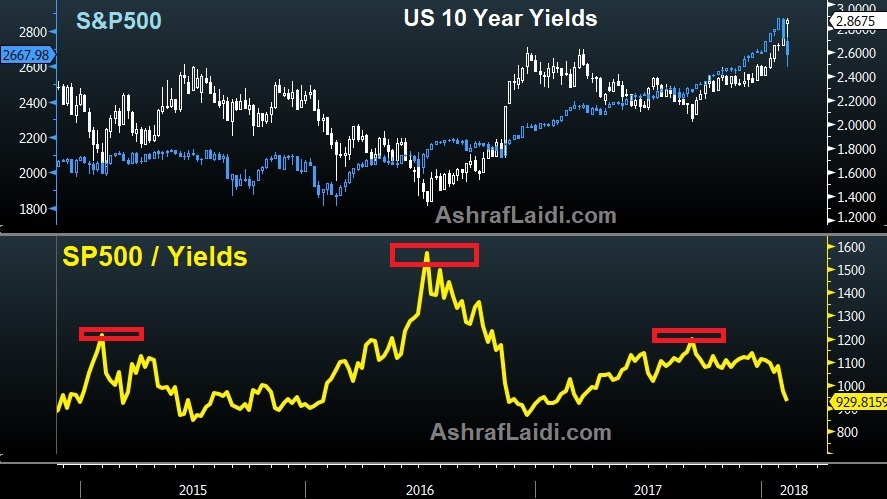
One key metric I am watching is the extent to which US bond yields have risen relative to the S&P500 index. The chart shows the SP500 / 10-year yield ratio falling to its lowest level since March 2017: Here is what it means and imply:
- The sell-off in equity indices is surpassing the selloff in bonds (advance in bond yields), in a manner not seen since summer 2016.
- Over the last 5 years, the chart shows there have been three episodes when stocks fell sharply relative to bond yields (Spring-Summer 2013, Spring 2015 and Summer-autumn 2016), each of which was brought about by an aggressive liftoff in bond yields. The catalysts to those gains were fears of faster tightening from the Federal Reserve, improved inflation data outside the United States bringing causing fears that central banks other than the US Federal Reserve will also be tightening monetary policy.
- Taking a closer look at the chart, we note that head-&-shoulders formation (technical analysis) is underway. If the pattern is valid, then it could portend further sharp declines ahead, with sombre implications for the price of equity indices. A 3% print on yields is highly likely at this point, in which case could extend the S&P500 to 2450 on the S&P500 from the current level of 2666.
Author

Ashraf Laidi
AshrafLaidi.com
Ashraf Laidi is an independent global markets strategist with over 15 years' experience. He is author of "Currency Trading & Intermarket Analysis", and founder of AshrafLaidi.com.


