Where did the trust go

S2N spotlight
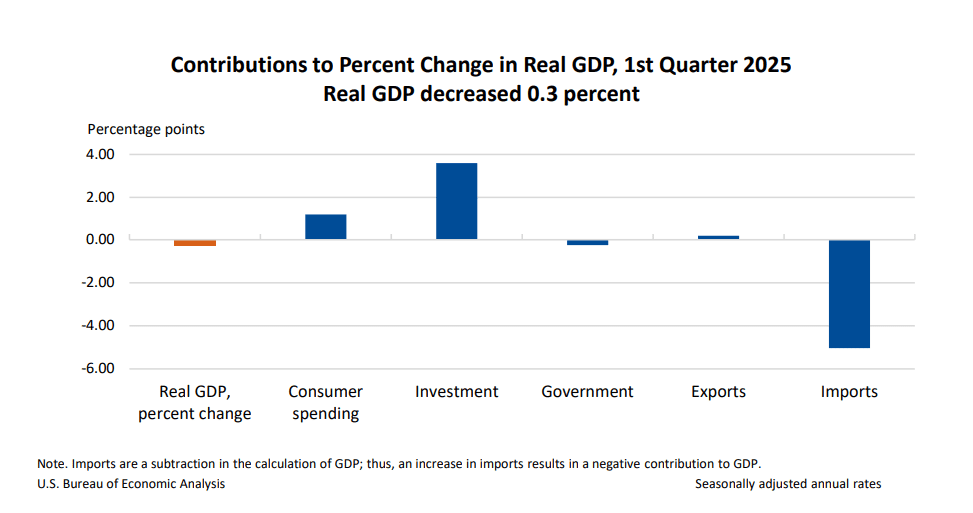
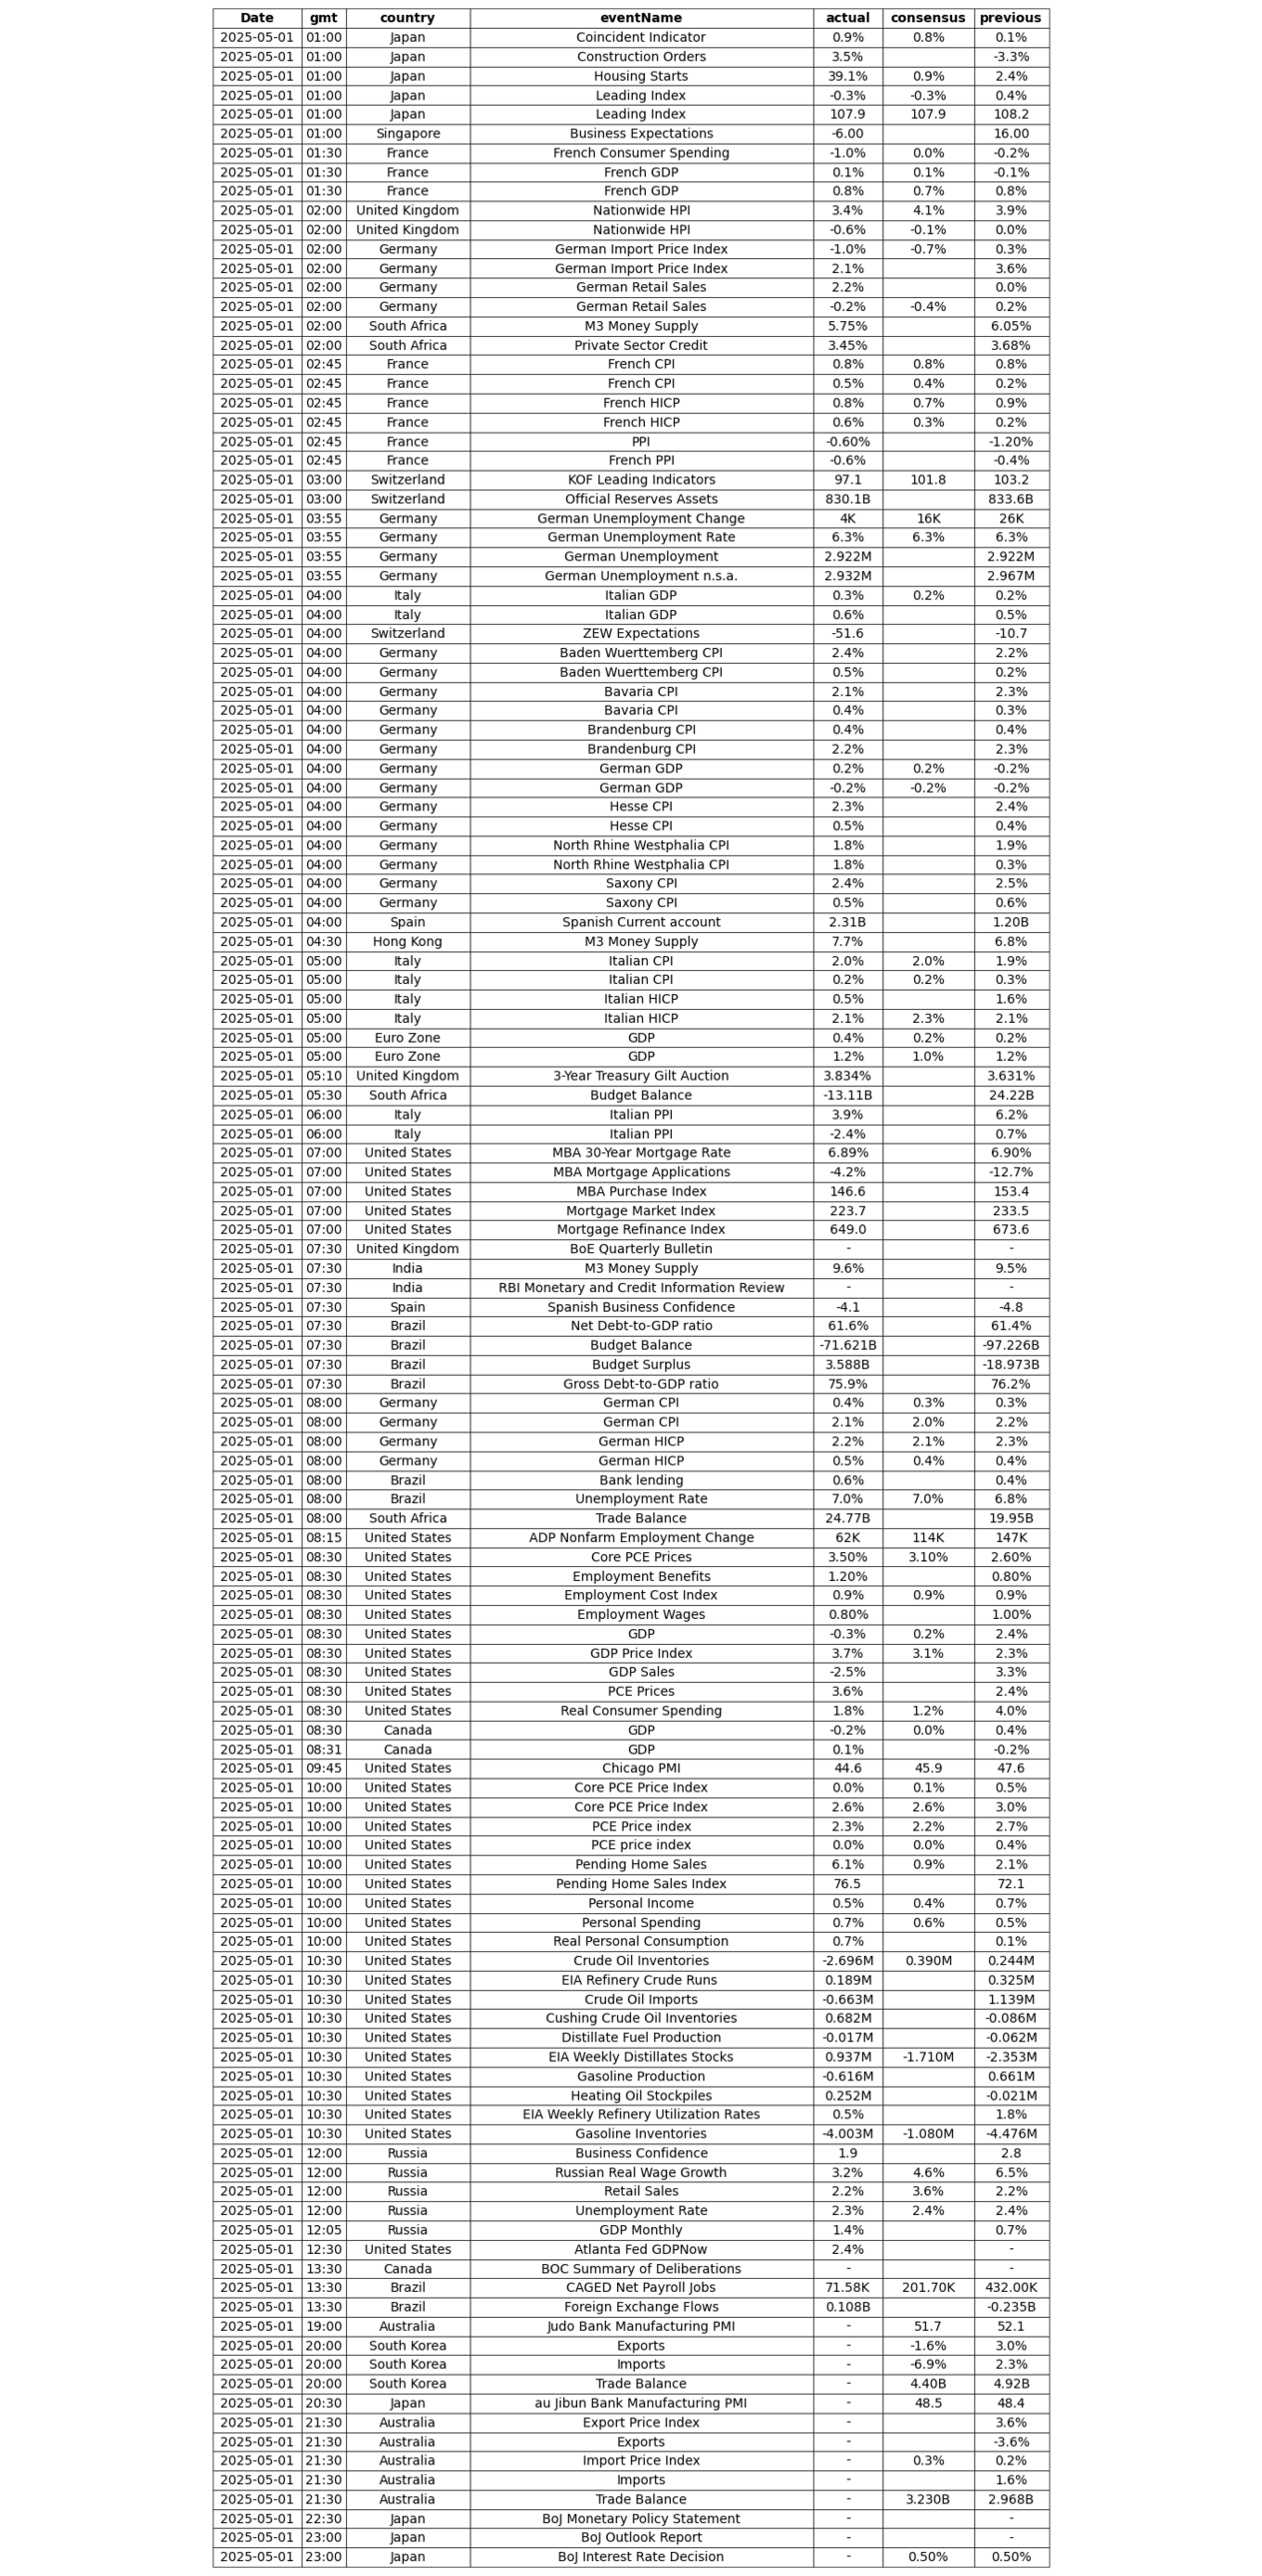
The big little news is the latest GDP for Q1 was a little negative, -0.3%. It is hard to see on my chart, but if you look hard enough, there is a red print.
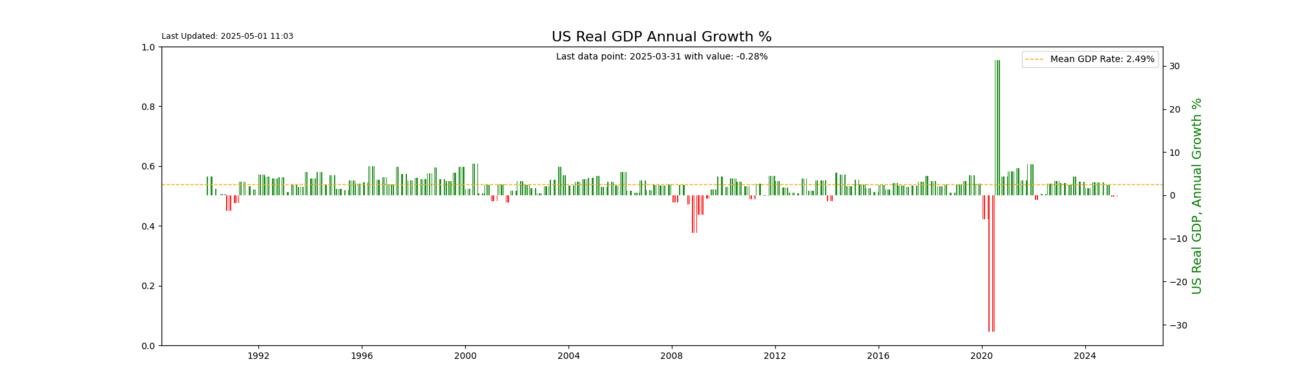
The biggest culprit was tariff front-running, i.e., people buying more imports than usual in anticipation of the tariffs.
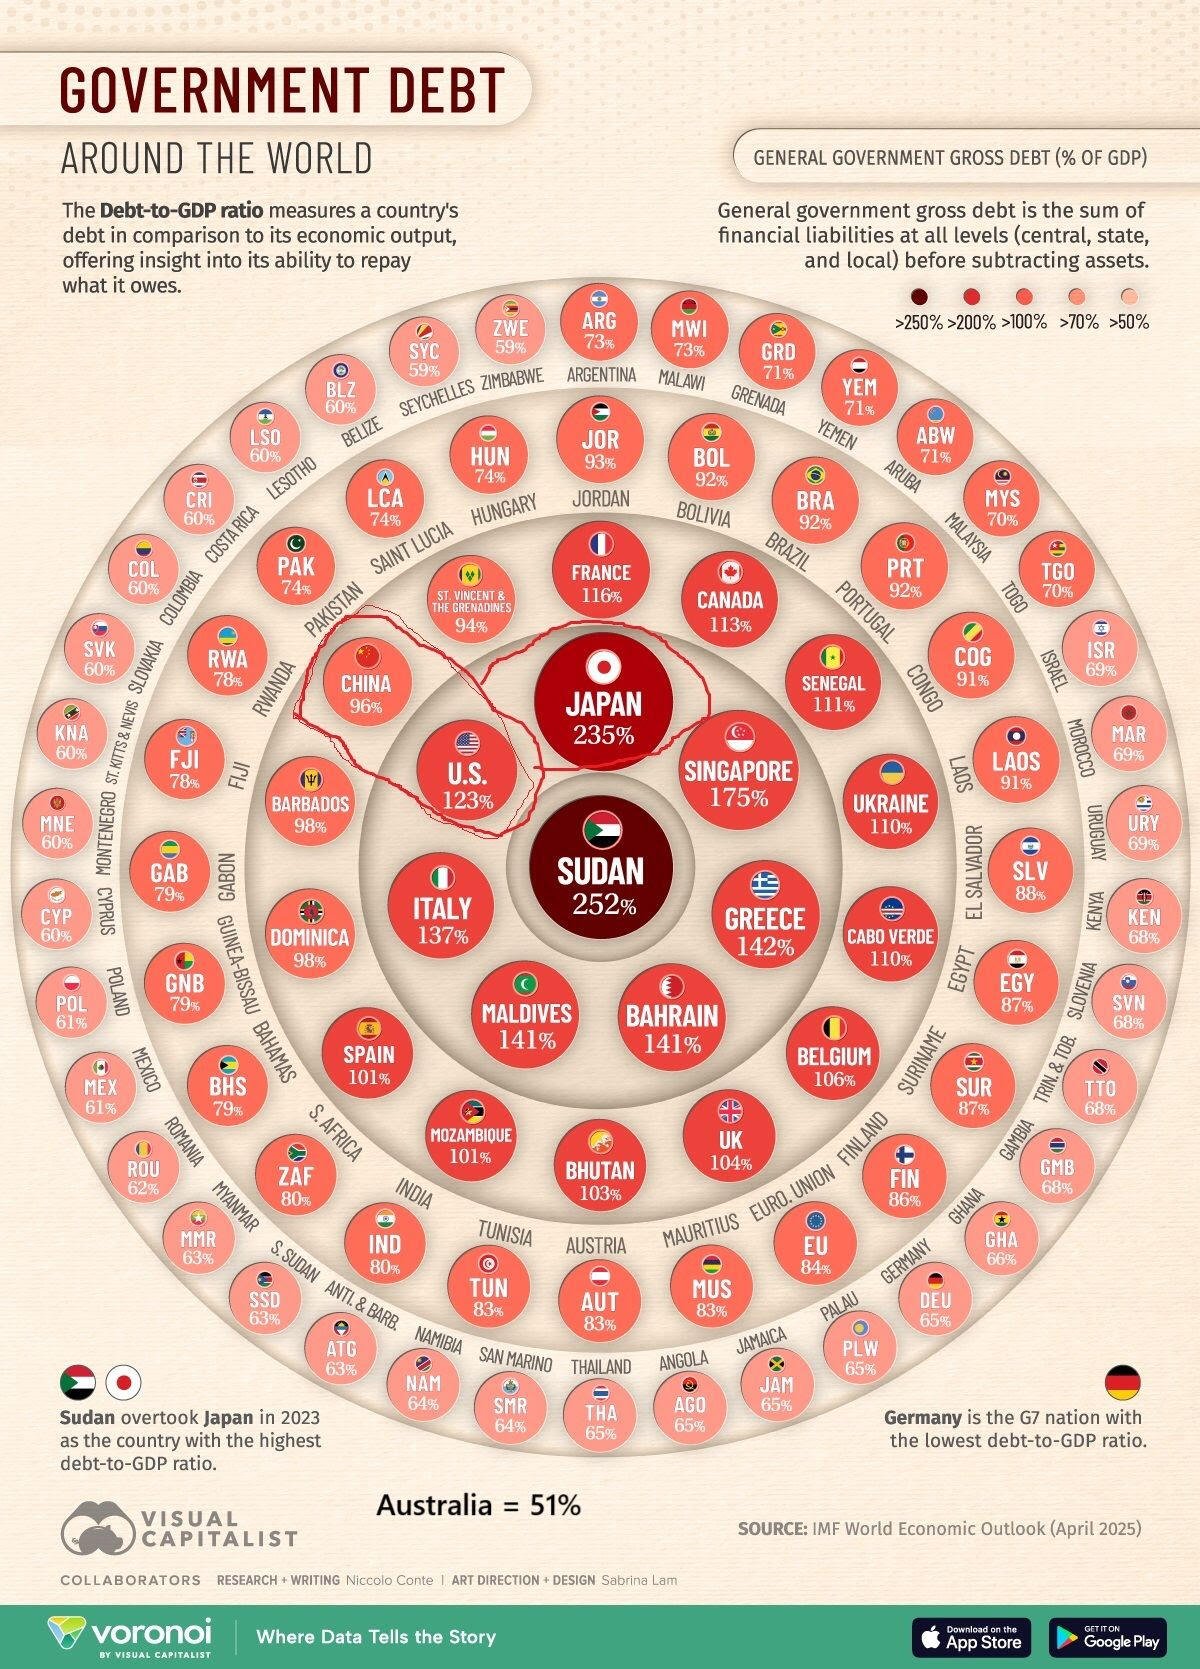
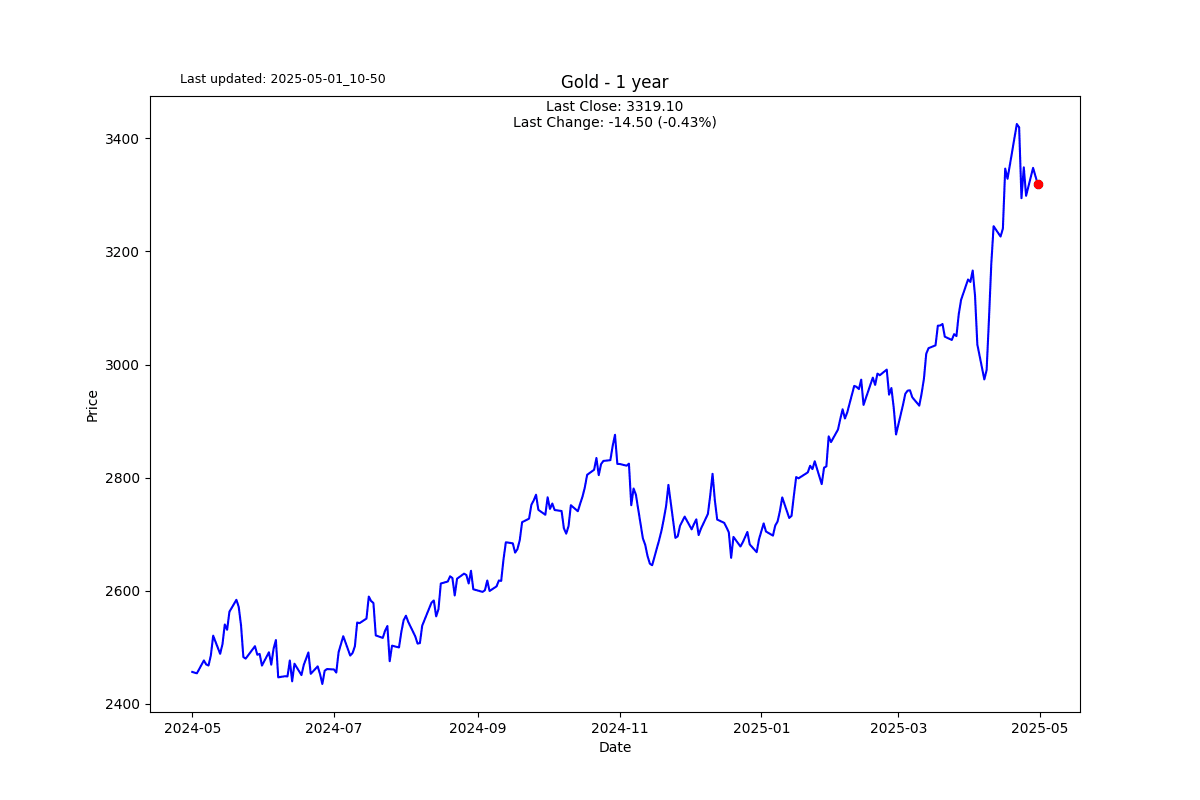
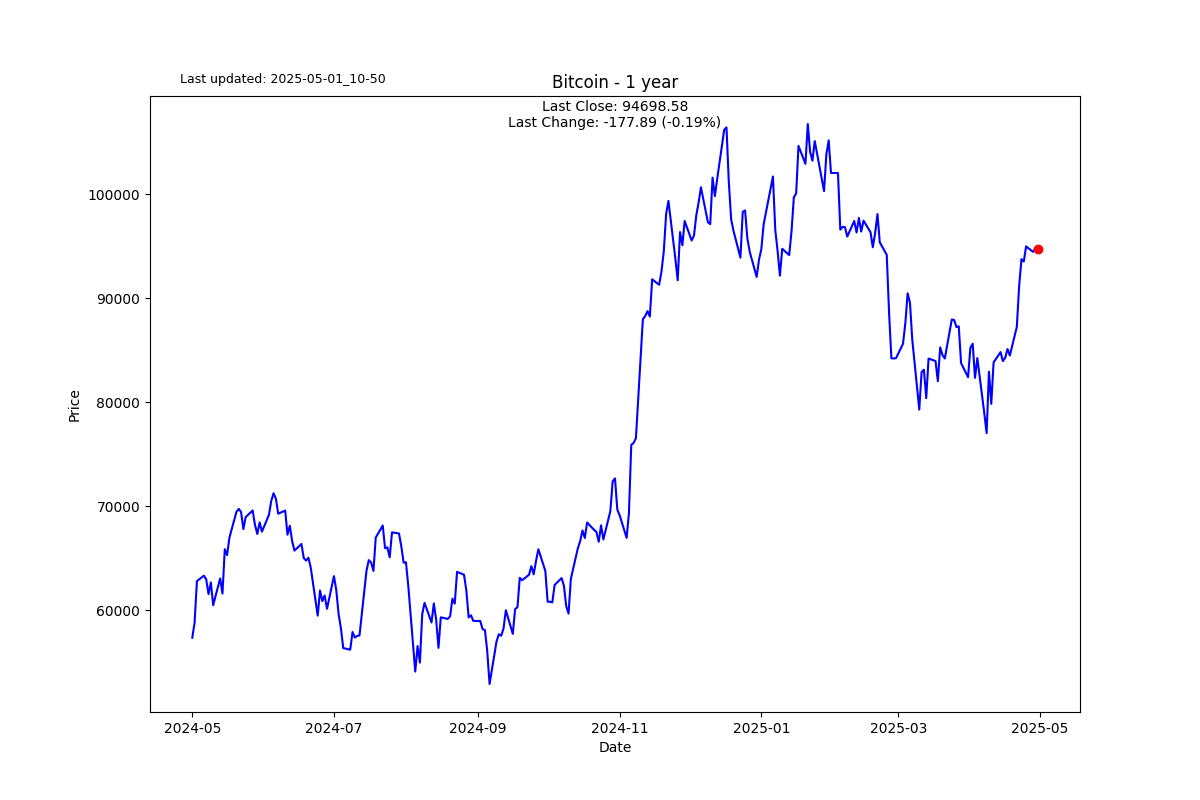
I want to address the dinosaur in the phone booth: government debt to GDP. After all, this is what has fuelled the crypto mob and the gold bugs.
US and Chinese debt and many other countries' debt are at a level that is considered unsustainable and will either lead to a default or devaluation. None of this is new to most people who have been following the markets. However, one should not make the mistake of thinking that the US is in a worse position than the rest of the world. In fact, despite its mountain of debt, I think it is better placed than many other major countries; that is why I am sharing this visualisation of 100 of the worst government-to-debt ratios. In true Australian style, we are not on this list with only 51% debt-to-GDP, an homage to our lucky country status. Note to government: luck only lasts for so long.
Let us digress a little and revisit some economic history.
Countries that debase their currency usually suffer; there are many examples from the Roman Empire in the 3rd Century AD to Weimar Germany to Argentina, Zimbabwe, Venezuela, and others.
Arie van Gemeren does a great job recounting how the Spanish Empire, at the height of its glory, self-destructed by taking its eye off the ball with silver minters working for the government watering down the silver they were producing, lining their pockets, and bringing an empire to its knees.
Like most collapses, they start slowly and then gain speed and are very hard to reverse, just ask my learner driver daughter. It all started because of a lack of trust. Traders with the Spanish started to notice that the silver coins never had typical silver durability and the sound when banging on the table just didn’t sound like sound money (you get the pun?). Before long, trading partners started melting the silver into bullion only to realise that they were being underpaid by ~30%. Things went downhill fast from there; by the early 1640s, the Spanish Crown realised that many of their mint officials were on the take, but it was already too late.
What is important to take away from this is that superpowers like the US have come and gone through the annals of history. Trust is hard earned and quickly lost. I am praying that trust can be restored to the financial system before it is too late. I don’t think it is too late; but then again, I am usually early.
S2N observations
A pattern I have been noticing over the last few months with regularity that is not normal is the upward revisions to the previous months’ inflation numbers. This is classic manipulation if ever I have seen it.
The February month-to-month data was revised sharply higher today, driven by core services, which dominate the overall index.
-
Overall PCE: to +0.44% (5.5% annualised), from originally +0.33% (+4.0% annualized).
-
Core PCE: to 0.50% (+6.1% annualized), from originally +0.37% (+4.5% annualized).
-
Core services: to +0.52% (+6.5% annualised), from originally +0.35% (+4.3% annualised).
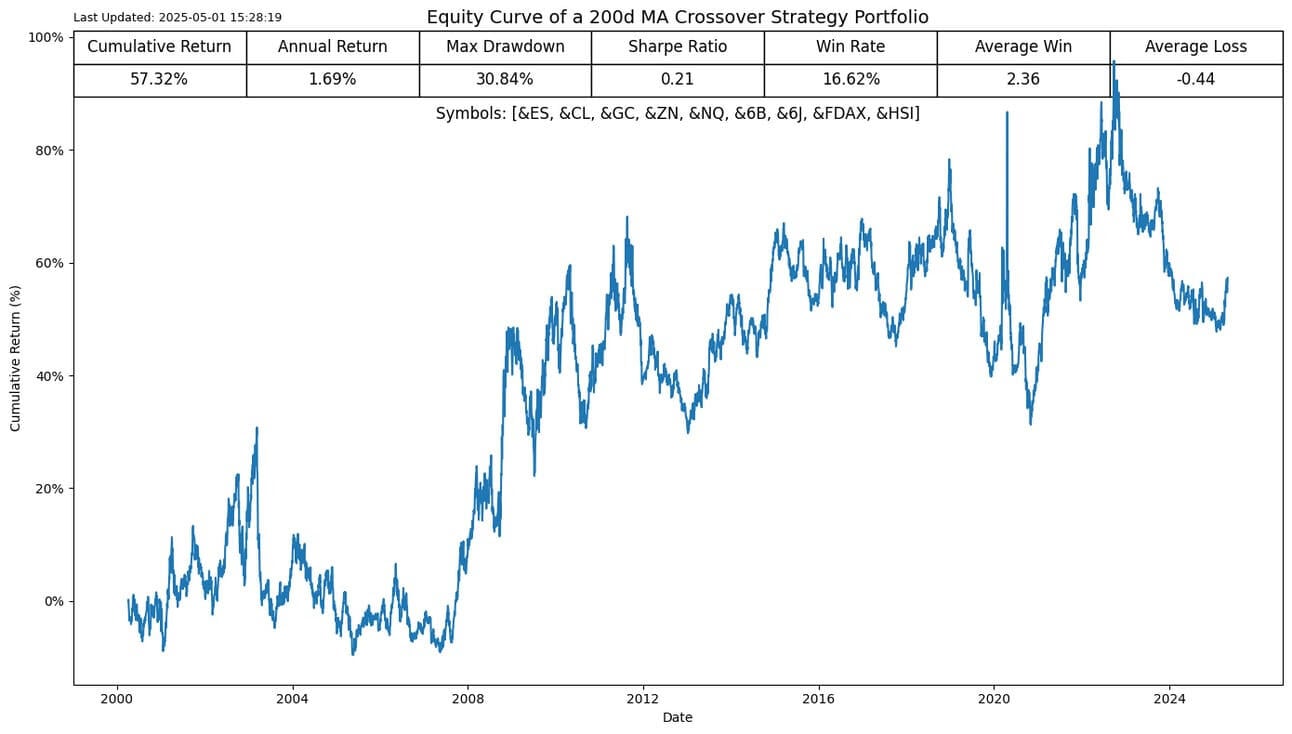
Over the last few months I haven’t been sharing different strategies like I have in the past; this is about to change soon. I have just purchased an institutional-grade financial Python library that is geared for heavy-duty backtesting and live trading. I am going to need some time to get familiar with the library and learn its database architecture, but I am excited about what it will do for Signal2Noise and its readers.
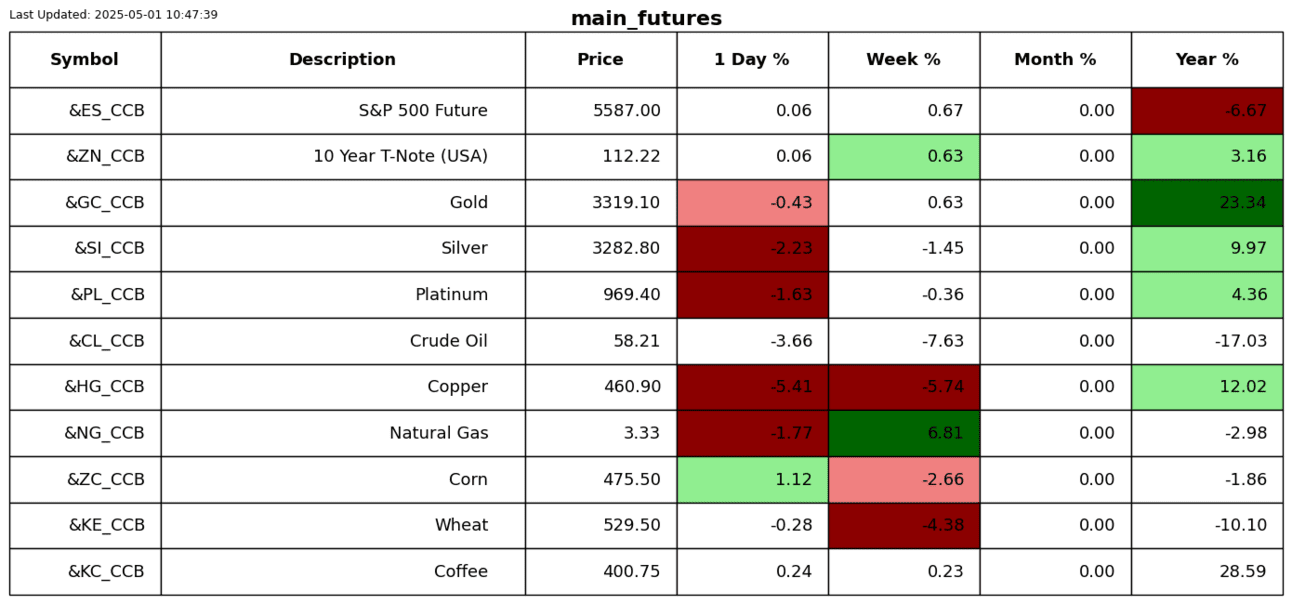
In the meantime, I ran my own backtest engine on a simple strategy of trading the 200-day moving average across 9 futures. The results are not particularly exciting. However, it is time to start sharing more sophisticated strategies that make you go wow.
S2N screener alert
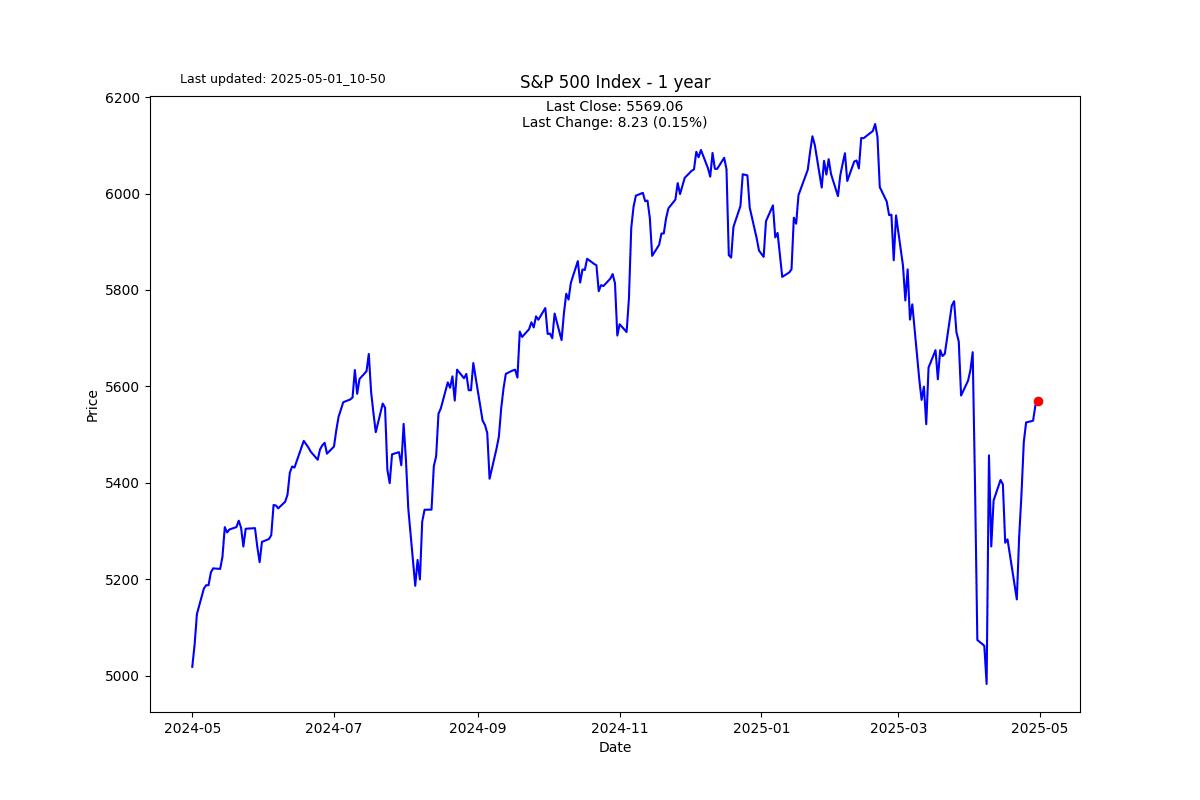
The S&P 500 has been up 7 days in a row, something relatively rare.
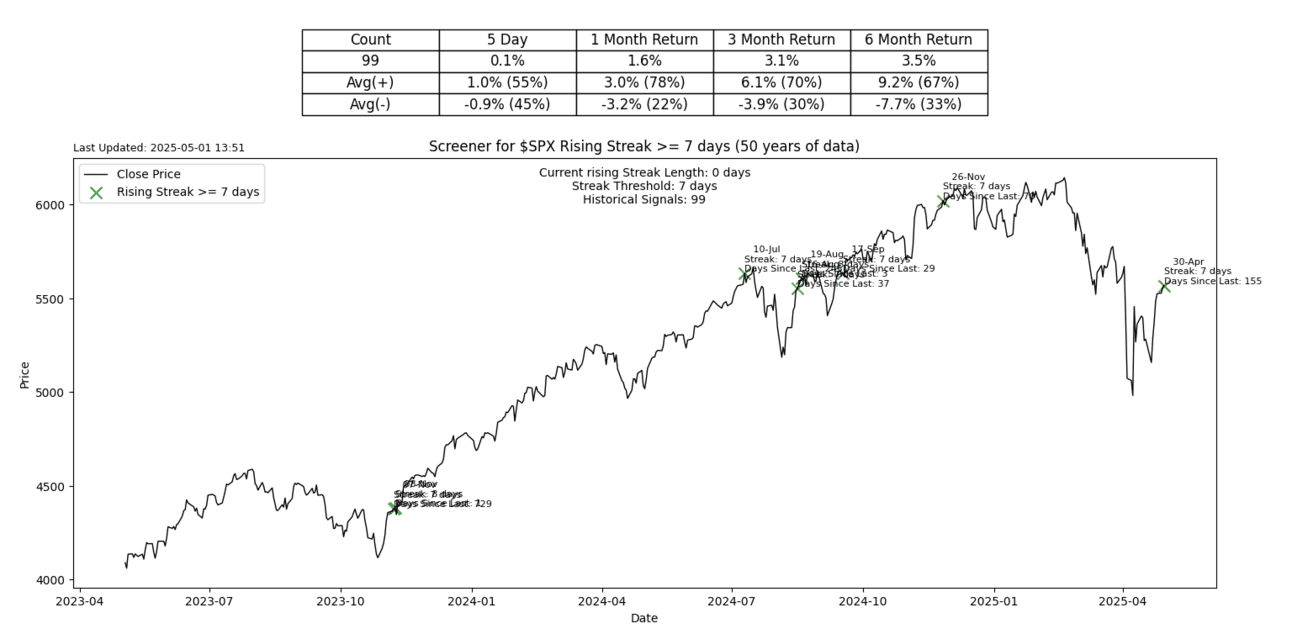
I decided to do some deeper probability analysis to see what the statistical probability of 7 up days is. Working on naïve probabilities, i.e., normal distributions, the answer is 1.184%.
The probability based on actual data since 1950 produces a probability of 0.610%.
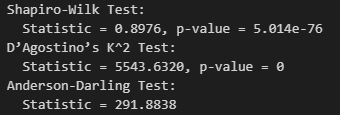
In case you were wondering, I ran 3 statistical tests to check for normality in the S&P 500 time series. All 3 tests rejected this. The takeaway is that almost all of us use classic statistical models that are not ideally suited for financial time series, and we should always keep that in mind. The results, in case you are interested.
S2N performance review
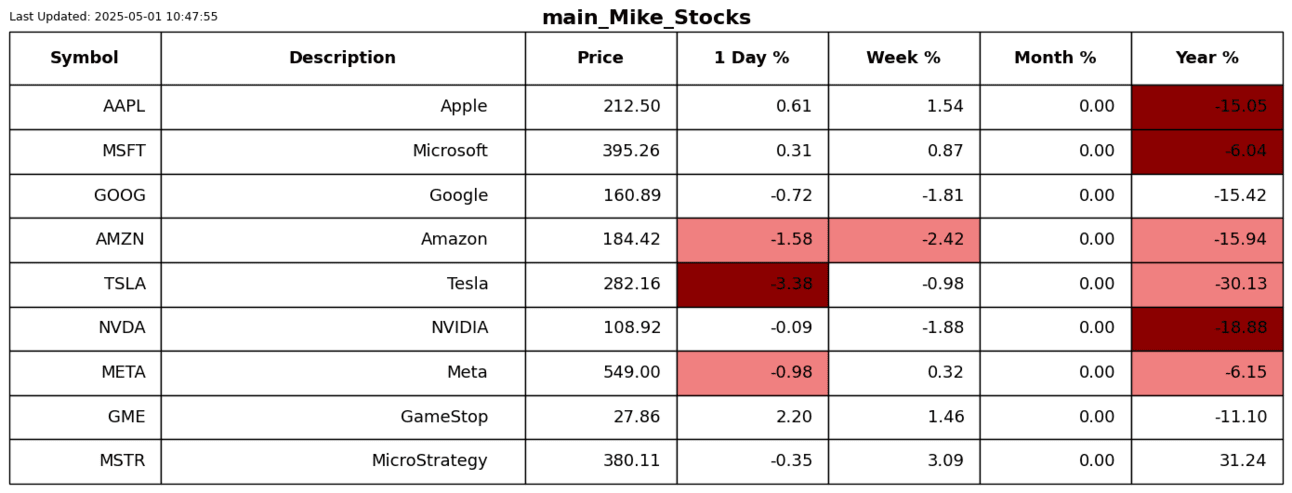
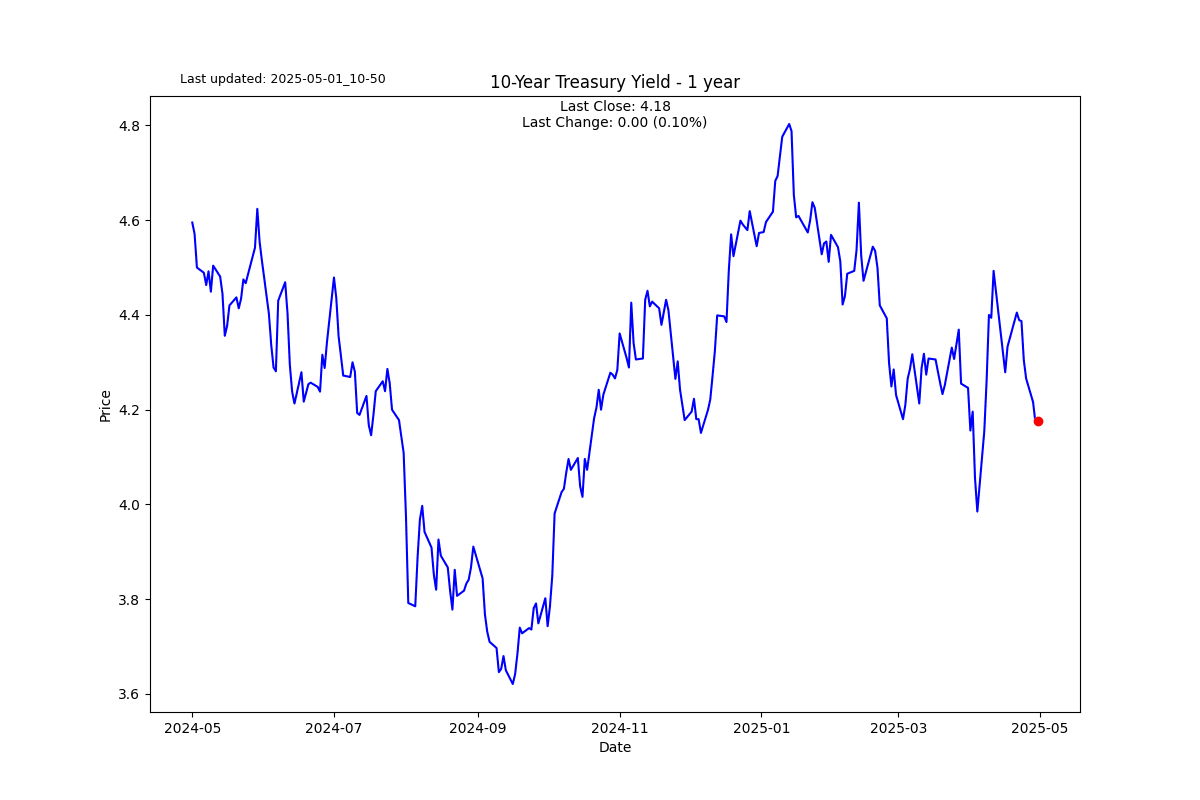
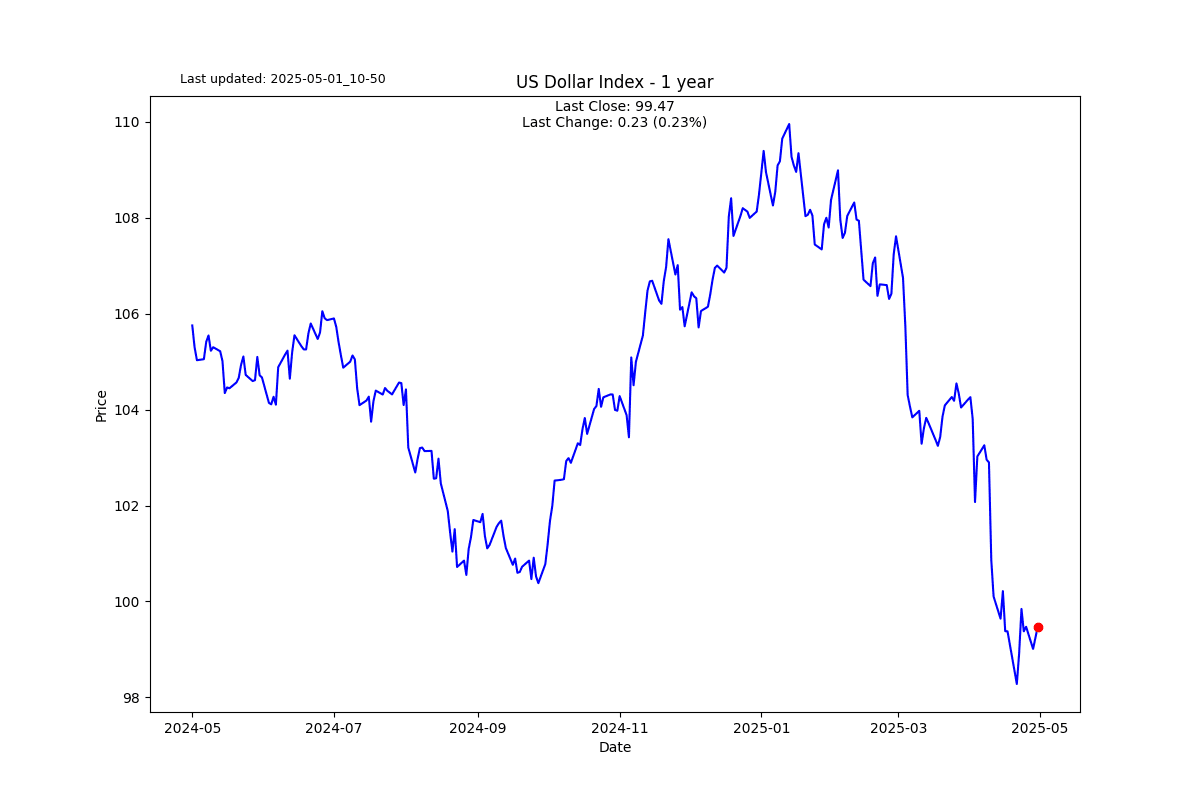
S2N chart gallery


S2N news today
Author

Michael Berman, PhD
Signal2Noise (S2N) News
Michael has decades of experience as a professional trader, hedge fund manager and incubator of emerging traders.


