Where Defense Spending Dollars Go: Top Ten States

A defense report, revised in March 2019 for fiscal year 2017, shows what states benefit the most from defense spending.
Please the US department of Defense report on Defense Spending by State for fiscal year 2017 as revised in March of 2019.
Conducted between June 2018 and November 2018, the analysis primarily entailed an examination of DoD prime and sub-contract award data and of defense personnel and payroll figures, which become reliable for analysis in March of each year. This report’s findings are drawn from numerous sources, including the DoD’s Defense Manpower Data Center; the U.S. Department of Commerce’s Bureau of Economic Analysis and Census Bureau; and USASpending.gov, which is managed by the U.S. Department of the Treasury.
Overview
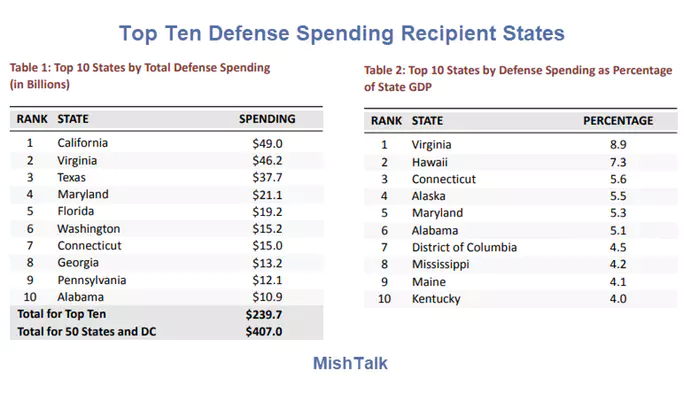
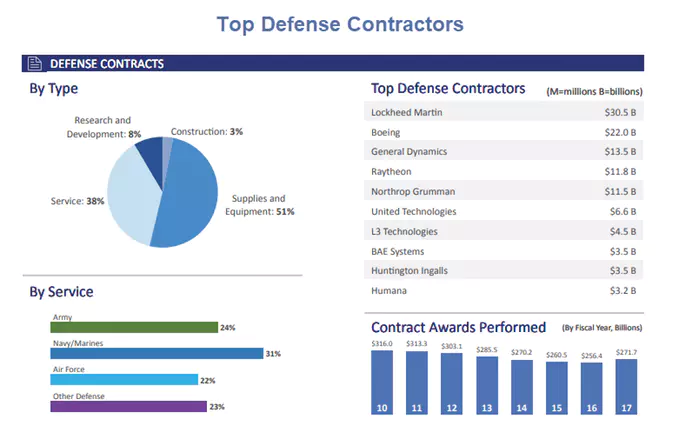
In FY 2017, DoD spent $407 billion on contracts and payroll in all 50 states and the District of Columbia, approximately $1,466 per U.S. resident. This spending accounted for 2.3 percent of the country’s gross domestic product (GDP) in 2017, and was higher as a share of GDP than the $378.5 billion spent in FY 2016. Of these funds, $271.7 billion (67 percent) was spent on contracts for various products and services, while the remaining $135.3 billion (33 percent) paid the salaries of DoD personnel. Most contract spending went to supplies and equipment (51 percent) or services (38 percent). The remainder supported research and development (8 percent) or construction (3 percent). Personnel pay was allocated fairly equally amongst active duty military (41 percent), the National Guard and the Reserves (31 percent), and civilians (28 percent). With regard to total defense spending by state, funding varied from $393.6 million in Wyoming to $49 billion in California, averaging $7.98 billion per state. Almost 59 percent of that funding ($239.7 billion) went to 10 states.
If this funding is examined as a component of the states’ economies, a slightly different picture emerges. On average, defense spending accounted for 2.3 percent of all states’ GDP in FY 2017, ranging from 0.5 percent in Oregon to 8.9 percent in Virginia. The defense spending of $1.3 billion in Oregon, for example, was a small portion of its $240.7 billion GDP, while Virginia’s $46.2 billion in defense spending accounted for a relatively larger segment of its $517.6 billion GDP.
Top Defense Contractors
Top Spending Locations

There are 128 pages by state, down to the county level.
Vote Buying
This is how and why people support perpetual war.
Anyone who does not support perpetual war is labeled "weak on defense". And of course, no Congressmen ever turn down projects in their own district.
Finally, much defense spending is hidden. Homeland security costs are not considered "defense".
Perpetual War
In reality, hardly any of this spending is "defense". It's primarily "offense".
We need to make enemies to support perpetual war.
Author

Mike “Mish” Shedlock's
Sitka Pacific Capital Management,Llc


