USD: Dec '23 is Down at 103.995.

Energies: Jan '24 Crude is Up at 73.95.

Financials: The Dec '23 30 Year T-Bond is Up 18 ticks and trading at 115.28.

Indices: The Dec '23 S&P 500 emini ES contract is 40 ticks Higher and trading at 4533.25 

Gold: The Dec'23 Gold contract is trading Up at 1992.40.  

Initial conclusion

This is not a correlated market. The USD is Down and Crude is Up which is normal, but the 30 Year T-Bond is trading Higher. The Financials should always correlate with the US dollar such that if the dollar is Higher, then the bonds should follow and vice-versa. The S&P is Higher and Crude is trading Higher which is not correlated. Gold is trading Higher which is correlated with the US dollar trading Down. I tend to believe that Gold has an inverse relationship with the US Dollar as when the US Dollar is down, Gold tends to rise in value and vice-versa. Think of it as a seesaw, when one is up the other should be down. I point this out to you to make you aware that when we don't have a correlated market, it means something is wrong. As traders you need to be aware of this and proceed with your eyes wide open. All of Asia is trading Mixed. Europe is trading Higher at the present time.

Possible challenges to traders

  • Building Permits are out at 8:30 AM EST. This is Major.

  • Housing Starts are out at 8:30 AM EST. This is Major.

  • FOMC Member Goolsbee Speaks at 9:45 AM EST. This is Major.

Treasuries

Traders, please note that we've changed the Bond instrument from the 30 year (ZB) to the 10 year (ZN). They work exactly the same.  

We've elected to switch gears a bit and show correlation between the 10-year bond (ZN) and the S&P futures contract. The S&P contract is the Standard and Poor's, and the purpose is to show reverse correlation between the two instruments. Remember it's likened to a seesaw, when up goes up the other should go down and vice versa.  Today we aren't dealing with a correlated market and our bias is to the Upside.

Yesterday the ZN migrated Higher at around 9:30 AM EST as the S&P hit a High at around the same time. If you look at the charts below the S&P gave a signal at around 9:30 AM and the ZN started its Upward trend. Look at the charts below and you'll see a pattern for both assets. S&P hit a High at around 9:30 AM and migrated Lower.  These charts represent the newest version of MultiCharts and I've changed the timeframe to a 15-minute chart to display better. This represented a Long opportunity on the 10-year note, as a trader you could have netted about 20 ticks per contract on this trade. Each tick is worth $15.625.  Please note: the front month for the ZN is now Dec '23. The S&P contract is now Dec' 23. I've changed the format to filled Candlesticks (not hollow) such that it may be more apparent and visible.  

Charts courtesy of MultiCharts built on an AMP platform

Chart

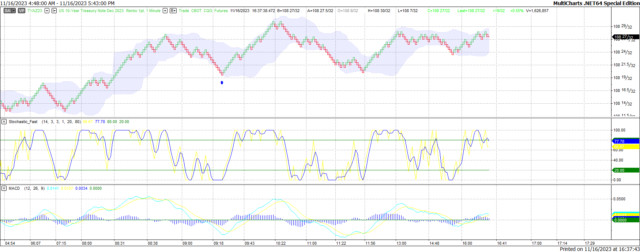
ZN - Dec 2023 - 11/16/23

Chart

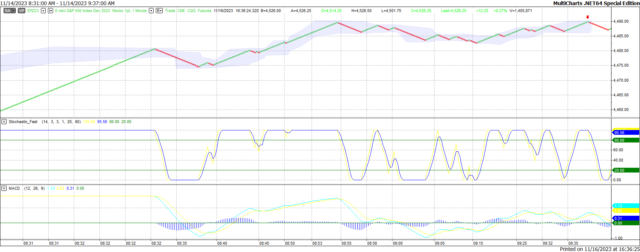
S&P - Dec 2023 - 11/16/23

Bias

Yesterday we gave the markets a Downside bias and up until the final session minutes all indices were lower but then at the last minute the S&P and Nasdaq closed fractionally Higher.  The Dow traded Lower by 46 points. Today we aren't dealing with a correlated market and our bias is to the Upside.

Could this change? Of Course. Remember anything can happen in a volatile market. 

Commentary

Wednesday and Thursday President Biden had his meeting with Chinese President Xi.  All seemed well as the two men walked thru a picturesque park in the San Francisco area. But then yesterday Biden called President Xi a "Dictator" as a gaffe. I don't know Joe, I thought you had more brains than that. This is not the way to win friends or influence people. I always viewed the current president as someone who had more tact and diplomacy than his predecessor. Now it looks like Trump wasn't wrong about Joe. Today we are light on economic news as we only have Building Permits and Housing Starts.

Trading performance displayed herein is hypothetical. The following Commodity Futures Trading Commission (CFTC) disclaimer should be noted.

Hypothetical performance results have many inherent limitations, some of which are described below. No representation is being made that any account will or is likely to achieve profits or losses similar to those shown.

In fact, there are frequently sharp differences between hypothetical performance results and the actual results subsequently achieved by any particular trading program. One of the limitations of hypothetical performance trading results is that they are generally prepared with the benefit of hindsight.

In addition, hypothetical trading does not involve financial risk, and no hypothetical trading record can completely account for the impact of financial risk in actual trading. For example, the ability to withstand losses or to adhere to a particular trading program in spite of trading losses are material points which can also adversely affect actual trading results.

There are numerous other factors related to the markets in general or to the implementation of any specific trading program which cannot be fully accounted for in the preparation of hypothetical performance results and all of which can adversely affect actual trading results.

Trading in the commodities markets involves substantial risk and YOU CAN LOSE A LOT OF MONEY, and thus is not appropriate for everyone. You should carefully consider your financial condition before trading in these markets, and only risk capital should be used.

In addition, these markets are often liquid, making it difficult to execute orders at desired prices. Also, during periods of extreme volatility, trading in these markets may be halted due to so-called “circuit breakers” put in place by the CME to alleviate such volatility. In the event of a trading halt, it may be difficult or impossible to exit a losing position.

Recommended Content


Recommended Content

Editors’ Picks

AUD/USD holds below 0.6400 amid signs of easing US-China tensions

AUD/USD holds below 0.6400 amid signs of easing US-China tensions

The AUD/USD pair trades in negative territory near 0.6390 during the early Asian session on Monday. The US Dollar edges higher against the Aussie amid signs of easing US-China tensions. China will hold a press conference about policies and measures on stabilizing employment and ensuring stable growth on Monday, which will be closely watched by traders.

AUD/USD News
USD/JPY holds steady above mid-143.00s amid Trump's uncertainty

USD/JPY holds steady above mid-143.00s amid Trump's uncertainty

USD/JPY kicks off the week on a subdued note and consolidates above mid-143.00s amid mixed cues. Investors push back expectations for an immediate BoJ rate hike amid rising economic risks from US tariffs, which acts as a headwind for the JPY and lends support to the pair amid a modest USD uptick. 

USD/JPY News
Gold edges lower to near $3,300 as US-China trade tensions ease

Gold edges lower to near $3,300 as US-China trade tensions ease

Gold price loses ground to near $3,310 in Monday’s early Asian session, down 0.30% on the day. De-escalating trade tensions between the US and China underpins the Gold price. The fears of the US recession might help limit the Gold’s losses. 

Gold News
Week ahead: US GDP, inflation and jobs in focus amid tariff mess

Week ahead: US GDP, inflation and jobs in focus amid tariff mess

Barrage of US data to shed light on US economy as tariff war heats up. GDP, PCE inflation and nonfarm payrolls reports to headline the week. Bank of Japan to hold rates but may downgrade growth outlook. Eurozone and Australian CPI also on the agenda, Canadians go to the polls.

Read more
Week ahead: US GDP, inflation and jobs in focus amid tariff mess – BoJ meets

Week ahead: US GDP, inflation and jobs in focus amid tariff mess – BoJ meets

Barrage of US data to shed light on US economy as tariff war heats up. GDP, PCE inflation and nonfarm payrolls reports to headline the week. Bank of Japan to hold rates but may downgrade growth outlook. Eurozone and Australian CPI also on the agenda, Canadians go to the polls.

Read more
The Best brokers to trade EUR/USD

The Best brokers to trade EUR/USD

SPONSORED Discover the top brokers for trading EUR/USD in 2025. Our list features brokers with competitive spreads, fast execution, and powerful platforms. Whether you're a beginner or an expert, find the right partner to navigate the dynamic Forex market.

Read More

Majors

Cryptocurrencies

Signatures

Best Brokers of 2025