Wheat Elliott Wave technical analysis [Video]
![Wheat Elliott Wave technical analysis [Video]](https://editorial.fxstreet.com/images/Markets/Commodities/Agriculture/wheat-field-and-male-hand-holding-cone-in-summer-day-43821148_XtraLarge.jpg)
Wheat Elliott Wave analysis - 23 February 24
Function - Counter-trend.
Mode - Corrective.
Structure - Zigzag.
Position - Blue wave b of black wave Y.
Direction - Blue Wave c of black wave Y.
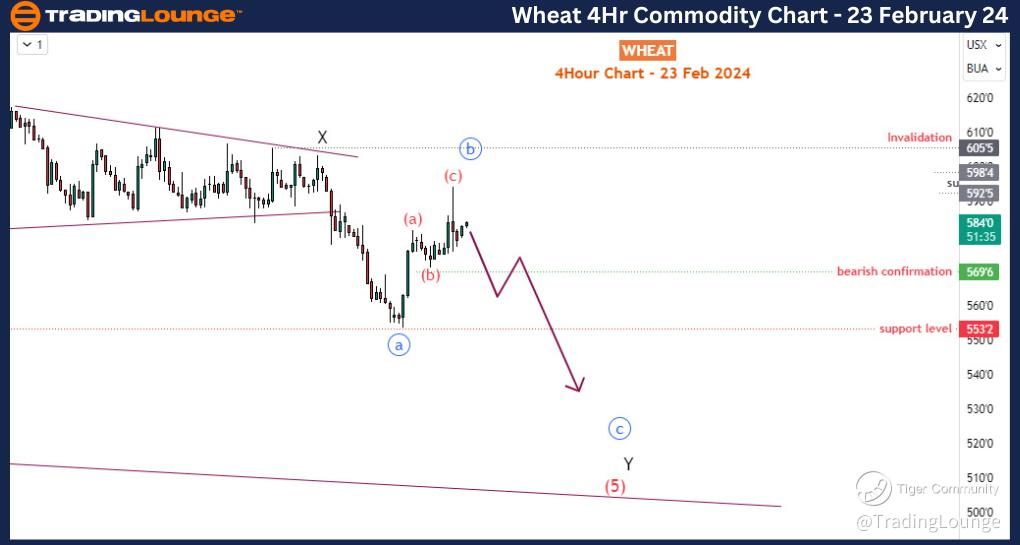
Details - Wheat bounced off the 555 support price level, as expected, to complete blue wave ‘b’ at the marked supply zone. If wave X does not get invalidated at 605 and the price breaks below 569, blue wave ‘c’ should be underway toward 530 at least.
In analyzing Wheat from an Elliott wave perspective, despite the current bounce, there remains a strong likelihood for a return to the downside to continue the bearish trend initiated since March 2022. Let's delve into our analysis:
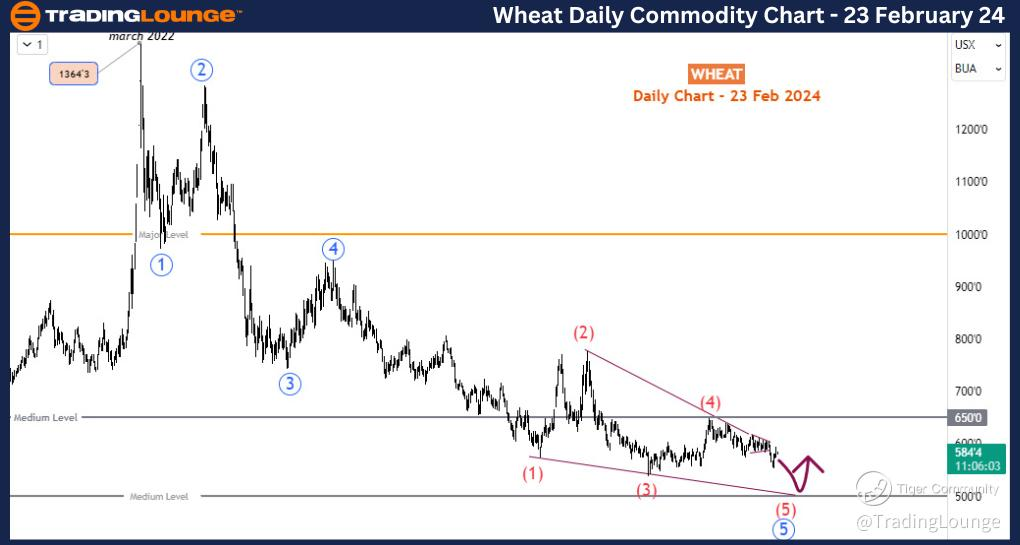
Examining the daily timeframe, the nearly two-year bearish trend has shown no significant inclination to reverse course. A textbook bearish impulse wave pattern from 1364 is evident, with the blue-labeled impulse wave decline now nearing completion of its 5th wave through an ending diagonal pattern. However, it's crucial to note that the ending diagonal 5th wave itself is in its 5th wave, indicating that Wheat may be approaching its bottom, a position not seen since the commencement of the bearish trend. While this pattern appears clear, confirmation of the completion of wave (5) of the diagonal awaits a breach above the 650 medium level from the current position. Failure to breach this level would likely lead to further decline toward the 500 medium level. Utilizing the h4 chart aids in comprehending the sub-waves of (5) and their role within the broader framework.
Transitioning to the H4 timeframe, a double zigzag (wave W-X-Y in black) bearish move commenced at the 650 medium level. Wave X finalized as a triangle at 605 before breaking downside to confirm the onset of wave Y. With wave Y expected to unfold in 3-waves, blue sub-wave ‘a’ concluded at the 553 support level, followed by a bounce in 3-waves for blue sub-wave ‘b’. Subsequent movement anticipates blue sub-wave ‘c’ initiating another sharp bearish move below 553, targeting 530 or lower. Confirmation for the sub-wave ‘c’ decline has been set at 569, with an invalidation level established at 605, where wave X terminated. A breach beyond this level would necessitate a reassessment of the outlook for black wave Y.
This analysis exemplifies our application of Elliott wave theory to navigate the market's intricacies.
Technical Analyst: Sanmi Adeagbo.
Author

Peter Mathers
TradingLounge
Peter Mathers started actively trading in 1982. He began his career at Hoei and Shoin, a Japanese futures trading company.


