Wheat technical analysis [Video]
![Wheat technical analysis [Video]](https://editorial.fxsstatic.com/images/i/wheat-02_XtraLarge.jpg)
Wheat Elliott Wave analysis
Function: Trend.
Mode: Trend.
Structure: Diagonal for wave V.
Position: Wave C of V.
Direction: Wave C of V is still in play.
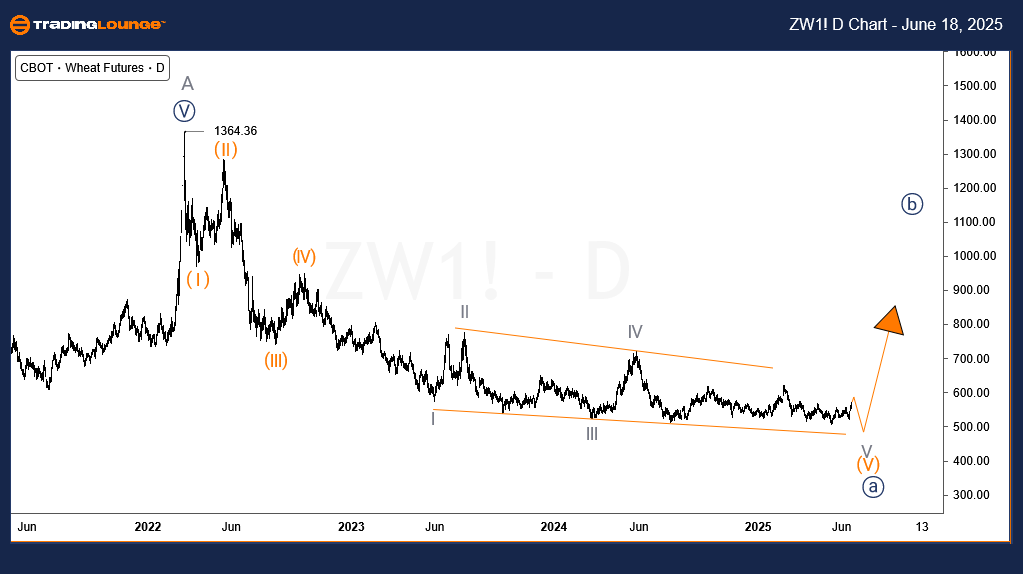
Wheat prices have extended their rally from May 13, 2025, and may soon reach an extreme level. This could mark the point where a new wave of selling begins. The broader bearish cycle that started in March 2022 still looks incomplete, suggesting that sellers might be preparing for renewed pressure.
Wheat daily chart analysis
Wheat is nearing the final phase of a bearish impulse wave that began in March 2022. The current fifth wave in this cycle has taken significantly more time to unfold compared to waves one through four. Despite this, the structure still appears unfinished. Wave (V), which started in October 2022, is forming an ending diagonal — a pattern that typically signals the conclusion of a trend. This suggests that a major bullish corrective phase, lasting months or even years, could start after one more downward leg.
Wheat four-hour chart analysis
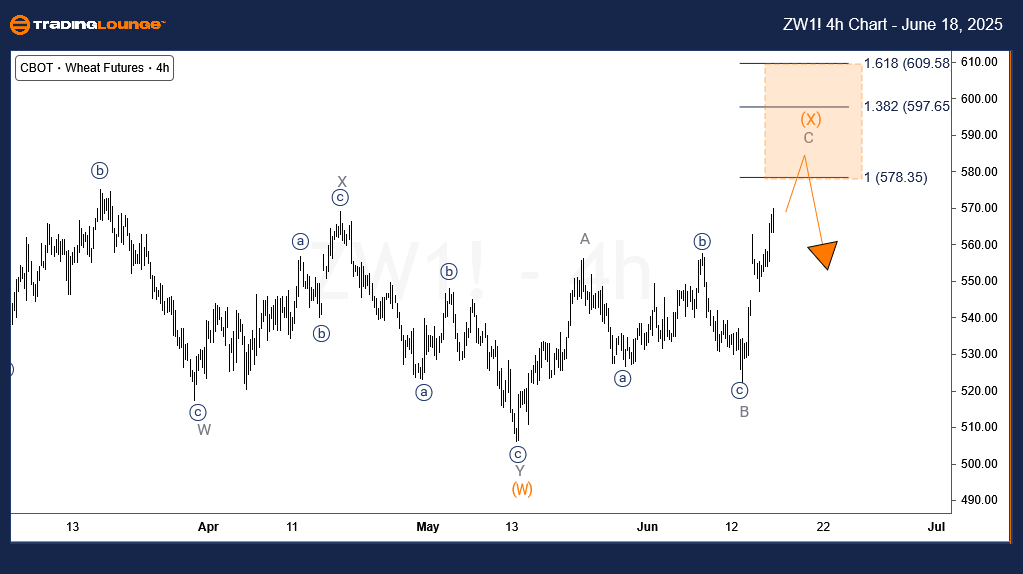
The 4-hour chart reveals that sub-wave ((B)) of V of (V) ended at 621 in February 2025. From that point, wave ((C)) began, completing sub-wave (W) of ((C)) on May 13, 2025. The current upward move represents wave (X) of ((C)), and it's expected to remain below 621.75. However, resistance is likely to form within the 609.58–578.35 range. Once this zone is tested, wave (Y) lower could begin, with potential price targets at $500 or below — a level likely to attract renewed selling pressure.
Wheat technical analysis [Video]
Author

Peter Mathers
TradingLounge
Peter Mathers started actively trading in 1982. He began his career at Hoei and Shoin, a Japanese futures trading company.


