Wheat Elliott Wave technical analysis [Video]
![Wheat Elliott Wave technical analysis [Video]](https://editorial.fxstreet.com/images/Markets/Commodities/Agriculture/farmer-hand-and-wheat-10066645_XtraLarge.jpg)
Wheat Elliott Wave analysis
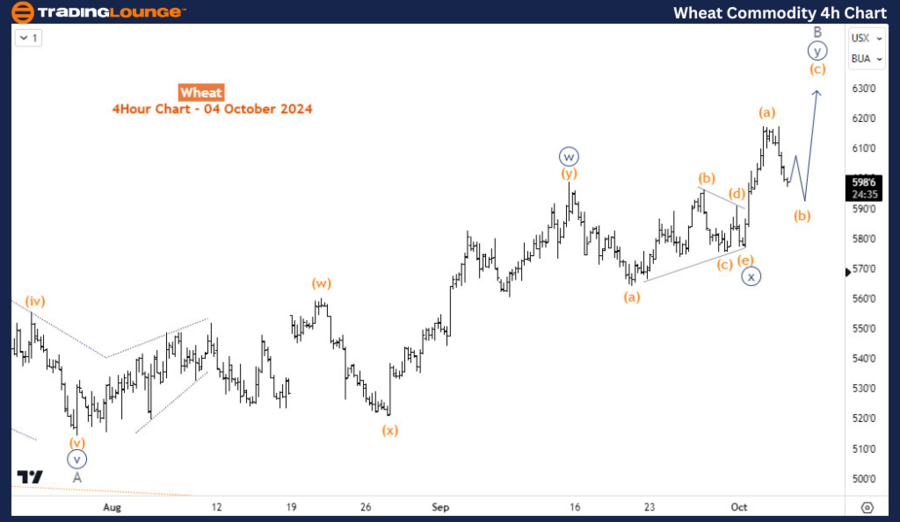
Wheat advances further from the lows of July 2024 and could be starting a much stronger bullish correction that could last for several more weeks. However, until it leaves the diagonal range and breaks above the top of May 2024, traders shouldn’t write off another sell-off in the last quarter of 2024.
Daily chart analysis
Specifically, the fifth wave—designated as wave 5 (circled) of the primary degree—is forming an ending diagonal structure. This diagonal is part of wave (5), which is expected to consist of three sub-waves. Currently, wave (5) is in its second phase—wave B—reflecting the recent bounce from July's low. Once this structure is completed, a further decline is anticipated for the final leg, known as wave C of (5). Following the completion of wave (5), prices are expected to retrace the entire decline that began from 1366, a process that may unfold over several months.
However, on the other hand, likely, wave (5) diagonal has already been concluded. If the current recovery continues higher above wave (4) (May 2024 high), we will confirm wave (5) of 5 (circled) as concluded at the July 2024 low. Thus, a stronger recovery that will correct the entire bearish impulse structure from March 2022 would ensue. Until that happens, one more leg lower for wave C of (5) after the current bounce for wave B completes should be considered.
H4 chart analysis
Wave B of (5) is extending higher while emerging into a double zigzag structure. Waves ((w)) and ((y)) of B have finished. Price is now in wave (b) of ((y)) of B. At least one more leg higher is expected for wave (c) of ((y)) ofB in the short term.
Technical analyst: Sanmi Adeagbo.
Wheat Elliott Wave analysis [Video]
Author

Peter Mathers
TradingLounge
Peter Mathers started actively trading in 1982. He began his career at Hoei and Shoin, a Japanese futures trading company.


