Wheat Elliott Wave technical analysis [Video]
![Wheat Elliott Wave technical analysis [Video]](https://editorial.fxstreet.com/images/Markets/Commodities/Agriculture/wheat-field-under-clear-blue-sky-17453573_XtraLarge.jpg)
Wheat Elliott Wave analysis
Wheat is currently experiencing a pullback after the rallies seen in August and early September. Since hitting a low in July 2024, the commodity has rallied over 11%. While this corrective bounce may persist for a while, the overarching trend remains bearish, indicating a potential continuation of the sell-off later in the year.
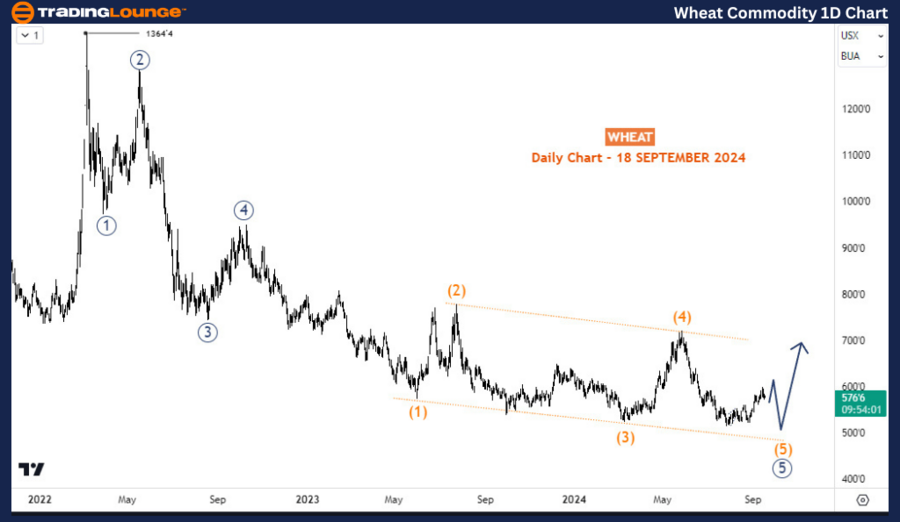
Daily chart analysis
Analyzing the daily chart, we observe that the bearish trend is completing an impulse sequence that started from the peak in March 2022, when prices reached 1364. It appears that the bearish impulse structure is nearing its conclusion. Specifically, the fifth wave—designated as wave 5 (circled) of the primary degree—is forming an ending diagonal structure. This diagonal is part of wave (5), which is expected to consist of three sub-waves. Currently, wave (5) is in its second phase—wave B—reflecting the recent bounce from July's low. Once this structure is completed, a further decline is anticipated for the final leg, known as wave C of (5). Following the completion of wave (5), prices are expected to retrace the entire decline that began from 1366, a process that may unfold over several months.
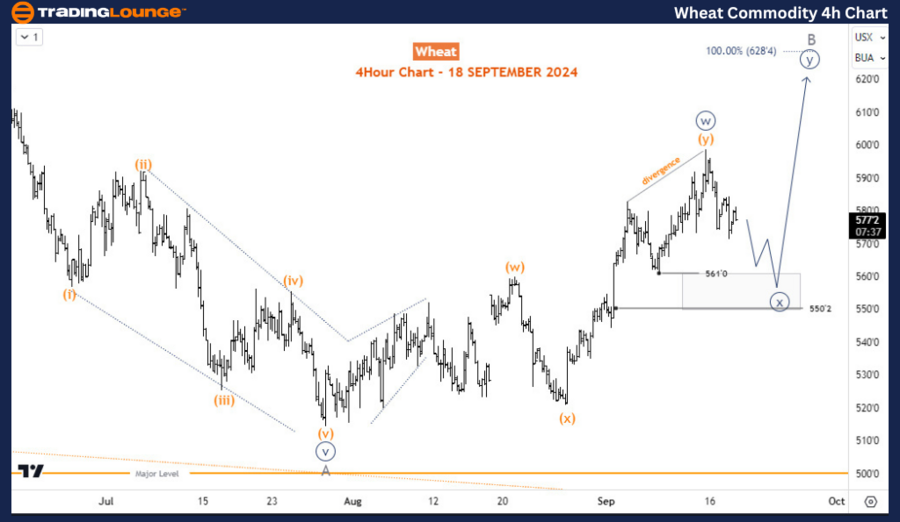
Four-hour chart analysis
On the H4 chart, we focus on the ongoing bounce from July 2024, identified as wave B of (5). It appears that a double zigzag structure has formed, potentially marking wave w (circled) of B or signaling the completion of wave B itself. If the current dip from September 13 holds above the key support level of 550-561, we may see an upward extension for wave B. Conversely, should the current bearish movement prove impulsive and break below 550, we would interpret wave B as having already concluded, paving the way for a downward trend in wave C of (5). This scenario emphasizes the importance of closely monitoring these critical support levels to gauge the future direction of wheat prices.
Wheat Elliott Wave technical analysis [Video]
Author

Peter Mathers
TradingLounge
Peter Mathers started actively trading in 1982. He began his career at Hoei and Shoin, a Japanese futures trading company.


