Wheat Elliott Wave technical analysis [Video]
![Wheat Elliott Wave technical analysis [Video]](https://editorial.fxstreet.com/images/Markets/Commodities/Agriculture/Wheat/farmer-hand-and-wheat-10066645_XtraLarge.jpg)
Wheat Elliott Wave analysis
Function - Trend.
Mode - Trend.
Structure - Impulse for wave (A).
Position - Wave 5 of (A).
Direction - Wave (B).
Details - Wave 5 of (A) could be completed with an ending diagonal. Pullback for (B) should begin afterwards.
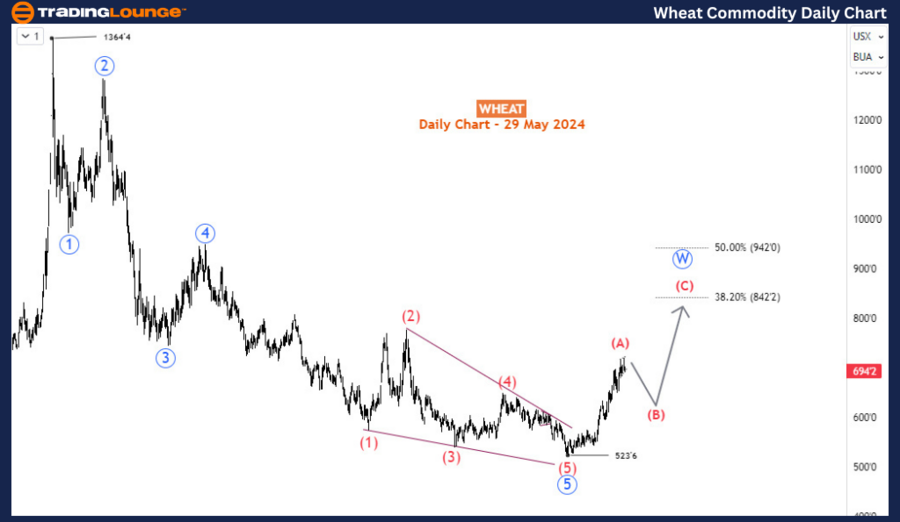
Since March 2024, wheat prices have been recovering and extending higher. However, a slowdown and a potential downward correction may occur in the coming days. Despite this, the overall recovery trend is expected to continue afterward. The initial recovery from the low of 523 in March is projected to advance towards the 840-940 range in the medium term. Nevertheless, the long-term bearish trend could resume in the last quarter of the year.
Examining the daily chart, we observe a bearish impulse wave that began at 1364 in March 2022, culminating in an impulse wave that reached 523 in March 2024, thus concluding a two-year sell-off. The subsequent recovery from 523 is nearing the completion of an impulse wave. This suggests that we should anticipate at least an (A)-(B)-(C) bullish correction continuing towards higher price levels, likely in the 842-942 range, which corresponds to the 38.2-50% Fibonacci retracement zone. It is also possible for prices to move even higher. This bullish corrective cycle is projected to extend until the last quarter of the year. For now, the focus should be on the completion of wave (A) and the potential for a retracement in wave (B).
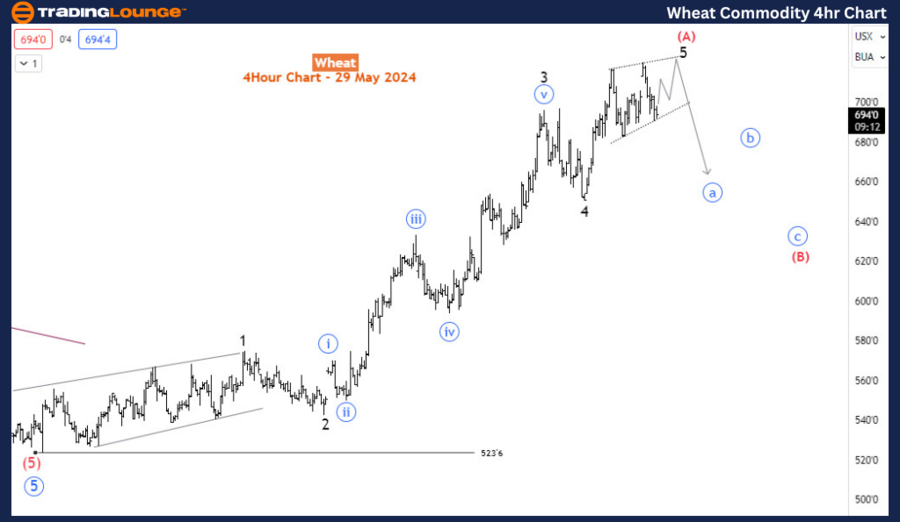
The H4 chart reveals that wave (A) is nearing its completion, forming an ending diagonal for wave 5. A bearish retracement for wave (B) is anticipated to start soon. The prudent strategy at this juncture is to wait for wave (B) to complete before considering long positions in wave (C), provided wave (B) does not breach the 523 low.
In summary, while wheat prices have been on an upward trajectory since March 2024, we may soon experience a short-term correction. However, the broader recovery trend is expected to persist, with prices potentially reaching the 840-940 range. Traders should monitor the progression of wave (A) and prepare for the likely retracement in wave (B). By closely observing the key level of 523, traders can ensure that the bearish wave (B) does not invalidate the recovery trend. If wave (B) remains above this level, the subsequent wave (C) could present a favorable opportunity for long positions, aligning with the projected medium-term bullish correction before the resumption of the long-term bearish trend later in the year.
Wheat Elliott Wave technical analysis [Video]
Author

Peter Mathers
TradingLounge
Peter Mathers started actively trading in 1982. He began his career at Hoei and Shoin, a Japanese futures trading company.


