What's up with Silver? It's still on sale

Silver is still on sale.
Despite the June rally that pushed silver from $33 to over $37 an ounce, the metal remains historically underpriced based on several metrics.
To begin with, there is still a historically wide gap between the price of silver and the price of gold.
The gold-silver ratio tells you how many ounces of silver it takes to buy one ounce of gold. The ratio is hovering right around 90-to-1. In the modern era, that ratio has averaged closer to 60-to-1. In other words, even with the recent rally, silver is underpriced compared to gold.
Historically, when the ratio has gotten out of whack like this, it has eventually snapped back to the mean with a surge in the price of silver. This has often happened in the midst of a gold bull rally, with silver outperforming gold.
For instance, in 2020, the gold-silver ratio set a record of 123-to-1 as Covid hysteria gripped the world and then plunged to around 60-to-1 as central banks around the world cranked up the money creation machine to cope with governments shutting down economies.
In another example of this snap-back, the gold-silver ratio fell to 30-to-1 in 2011 after rising to over 80-to-1 during the money creation of the Great Recession in the wake of the 2008 financial crisis.
Before the recent rally, the ratio was over 100-to-1, so silver has closed the gap some, but there is still a long way to go before we’re back to the historical average.
Meanwhile, silver also appears underpriced given the supply and demand dynamics.
Silver demand outstripped new supply for the fourth straight year in 2024 as industrial demand set another record.
Despite record industrial offtake, overall silver demand fell by about 3 percent to 1.16 billion ounces in 2024. This was primarily due to tepid investment demand, with coin and bar off-take falling 22 percent to a five-year low.
Even so, global silver demand exceeded silver supply last year, resulting in a structural market deficit of 148.9 million ounces.
These market deficits are expected to continue, and when investors hop on the train, we could see even larger supply shortfalls.
Bullish technical signals
We also have an extremely bullish technical setup with a classic “cup and handle” chart.
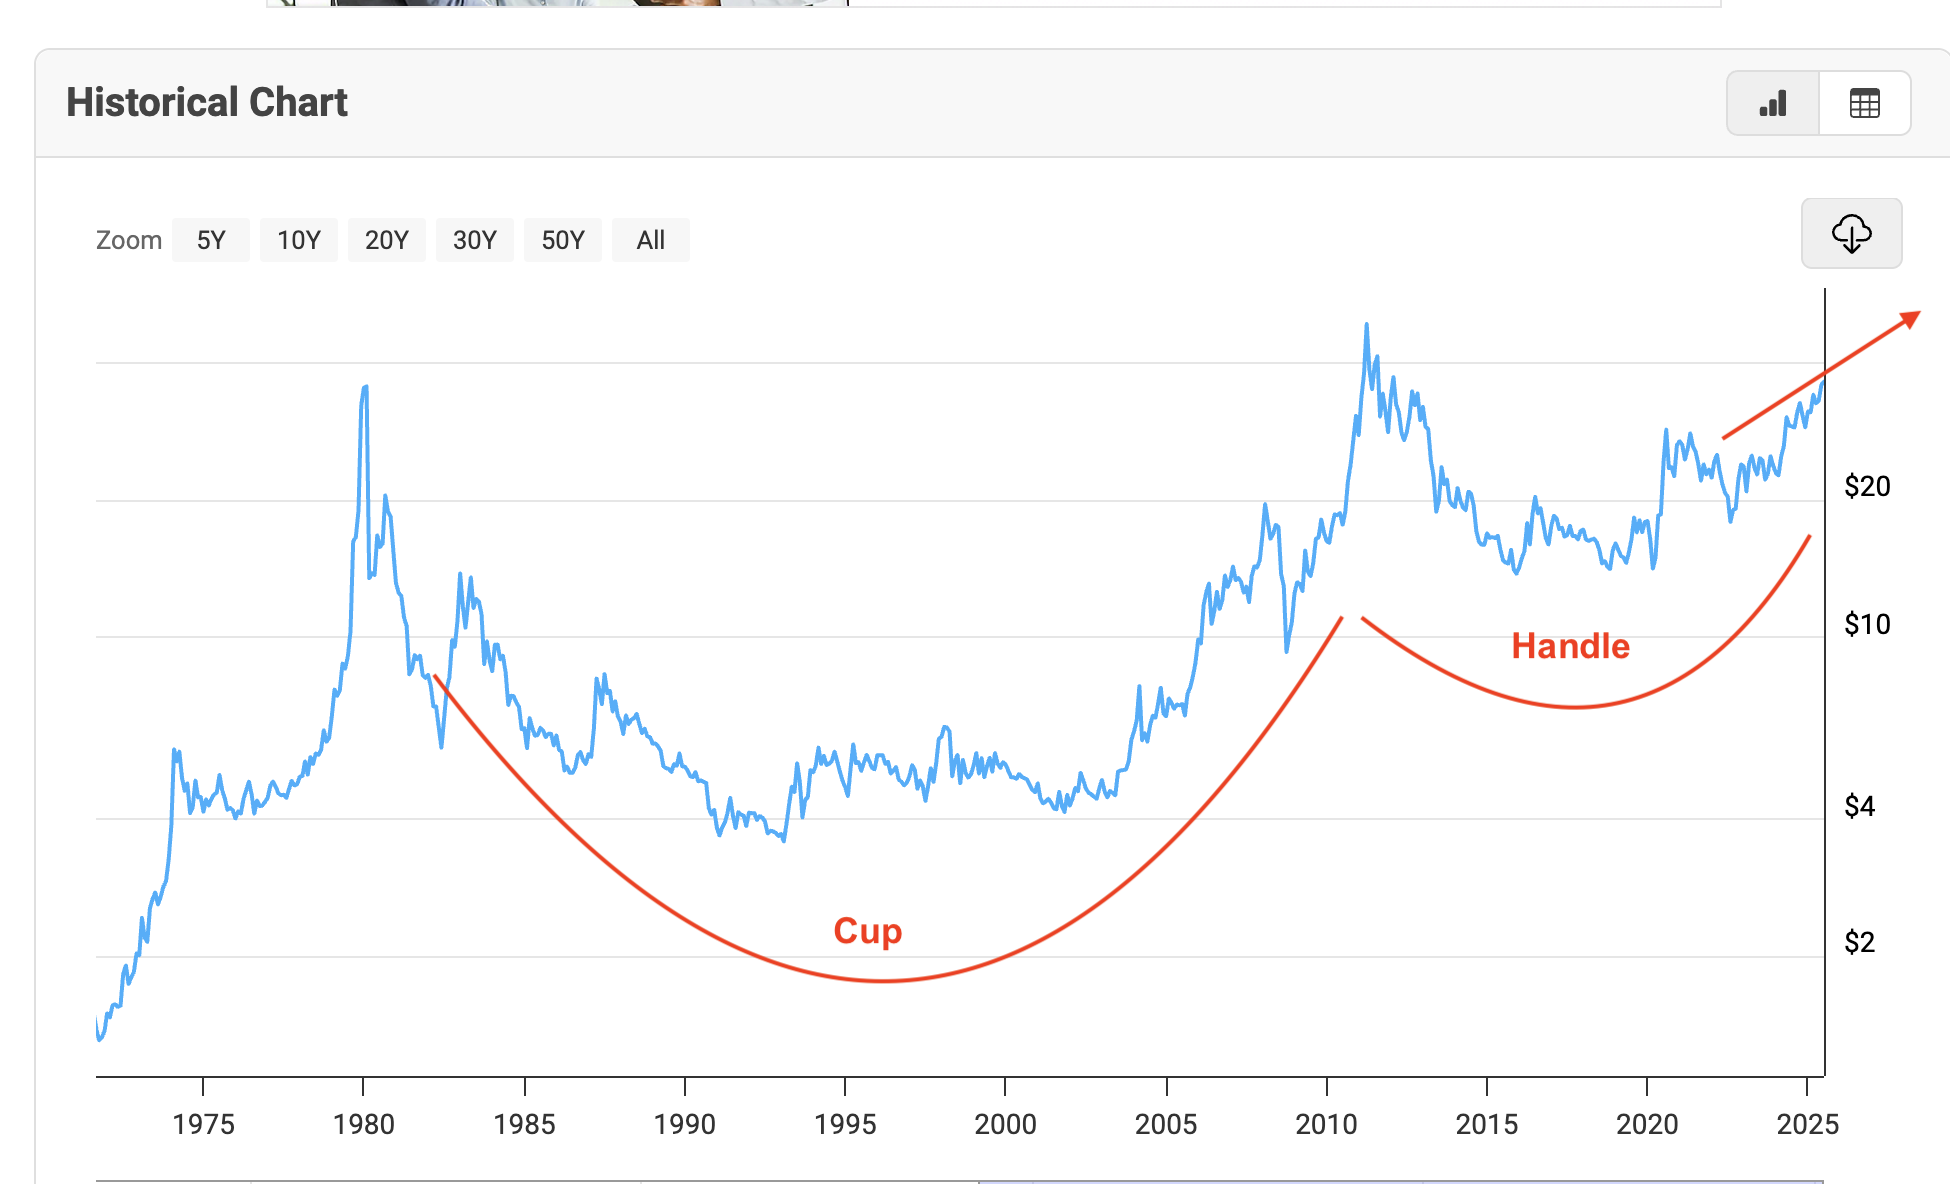
You can see the “cup” with the twin highs of around $50 per ounce in 1980 and 2011. Following the 2011 peak, we see a sharp decline in the price, followed by a consolidation “handle.”
A handle pattern on the chart of a stock or commodity often precedes a breakout.
This cup-and-handle pattern has played out over an extremely long timeframe. Historically, this longer pattern, often referred to as a secular cup and handle, portends a bigger breakout with a broader base, signaling a bigger upside case.
Gold followed a similar long-term pattern, resolving with a breakout to new all-time highs beginning in 2023.
Analyst Clive Maund argues that the technicals show silver is poised for another upleg similar to the one we saw in June.
Taken together, the technicals and the supply and demand dynamics tell us that despite the recent rally, silver is still on sale and there is plenty of life left in the bull's legs.
To receive free commentary and analysis on the gold and silver markets, click here to be added to the Money Metals news service.
To receive free commentary and analysis on the gold and silver markets, click here to be added to the Money Metals news service.
Author

Mike Maharrey
Money Metals Exchange
Mike Maharrey is a journalist and market analyst for MoneyMetals.com with over a decade of experience in precious metals. He holds a BS in accounting from the University of Kentucky and a BA in journalism from the University of South Florida.


