What happened to the Nasdaq on Thursday?
What to Worry about Today: Wrecked trendlines.
Rare and exceptional spikes on a chart have unfortunate effects on chartists, who start re-drawing lines madly to find a pattern. While patterns are indeed important and can be useful in creating forecasts (or at least alternative outcomes), wild moves can result in chart patterns that do not behave the way they "should."
The definitive pattern guru is Tom Bulkowski, who wrote The Book.
Here is the chart Bulkowski drew for the Nasdaq on Wednesday. He writes he sees a triple bottom with a breakout at A. It's also a descending triangle. "Both chart patterns are bullish when they breakout upward. Overhead is resistance setup by the cyan line." Bulkowski has done the homework to evaluate the probabilities of the patterns delivering their associated outcome. He says "The above probabilities say we have a 100% chance of closing higher tomorrow (Thursday). Does that mean we'll actually close higher? No. It means this might be the first time the index drops."
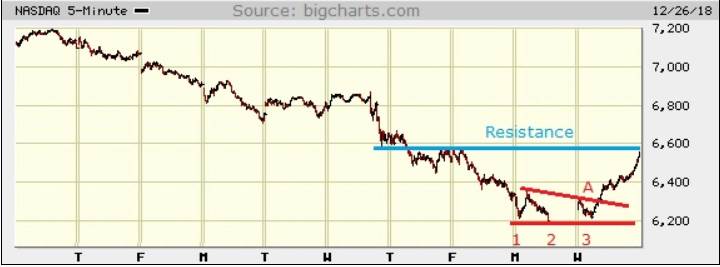
So, what happened to the Nasdaq on Thursday? It closed 0.38% higher.
As we wrote yesterday, don't read chatter about where the market might be going—any market. But if you simply can't resist, at least go the top expert.
Outlook:
The US government is partly closed. One of the department shut down is the Commerce Dept, which gives us GDP, inflation, personal income and spending, trade and new home sales. The Commerce Dept website is closed until further notice.
Meanwhile, private data providers are still working and today we get the Chicago PMI and pending home sales. The Chicago PMI could be scary, if only because the Nov numbers were wildly robust. See the chart. Tradingeconomics.com writes the barometer "rose to 66.4 in November of 2018 from 58.4 in October, beating market expectations of 58. It is the highest reading since December last year. Although broad-based, with increases across all five of the Barometer's subcomponents, resurgent orders, solid output and higher unfinished orders were the month's key drivers." It would be normal to see a pullback.
We have tended to give short shrift to Japan and the yen this year, mostly because we don't believe the endless stories about the BoJ embracing new ideas or taking unexpected policy measures. The last time we had something new was when the BoJ set a range for the 10-year yield centered at zero or 0.2% on either side.
Well, something has happened to wake us up—the 10-year JGB went negative overnight for the first time since Sept 2017. Japan has stopped trading for the 2018 year, so what a way to end the year, with panic flooding into the safe haven instrument. In order to own a 10-year Japanese government bond, you have to pay the government 0.01% to hold your money.
The WSJ notes that the BoJ saw it coming. The last policy meeting (Dec. 19-20) report released overnight contains this ominous phrase: "long-term yields should be allowed to temporarily turn negative." BoJ chief Kuroda, who knows a hawk from a handsaw, said "There's no need to worry if yields reflect the economy, prices and financial conditions at home and abroad."
In other words, people are scared about "conditions abroad" and have a right to be scared. More to the point, the implication is that the BoJ will not take countervailing measures.
The latest Tankan shows big manufacturers expect the dollar/yen at ¥109.41. We have ¥110.26 today. If the yen gets too much stronger, exporters will squeal. Here's the question: why do we not expect a similar effect in the US--bond yields falling back to 2%, say, and the dollar rising? We hesitate to say it, but Americans are less prone to market fear than Japanese, possibly because of a form of American can-do bravado. US market participants see the same frightening global conditions as the Japanese, chiefly the trade war, but are not as rattled by it. Japan is vastly more vulnerable to US bad behavior on the trade front. Trump has been rude and insulting to the Japanese, but has not yet turned the full force of his wrath upon them. They know it's coming. If fear gets even more of a grip, we need to worry about the dollar/yen returning to 104.64 (March 2018) or worse, 103.55 (June 2016).
We do not expect that fear to be contagious to other G7 currencies, except maybe Canada and Australia.
This is an excerpt from “The Rockefeller Morning Briefing,” which is far larger (about 10 pages). The Briefing has been published every day for over 25 years and represents experienced analysis and insight. The report offers deep background and is not intended to guide FX trading. Rockefeller produces other reports (in spot and futures) for trading purposes.
To get a free trial, please write to [email protected] and you will be added to the mailing list..
This is an excerpt from “The Rockefeller Morning Briefing,” which is far larger (about 10 pages). The Briefing has been published every day for over 25 years and represents experienced analysis and insight. The report offers deep background and is not intended to guide FX trading. Rockefeller produces other reports (in spot and futures) for trading purposes.
To get a two-week trial of the full reports plus traders advice for only $3.95. Click here!
Author

Barbara Rockefeller
Rockefeller Treasury Services, Inc.
Experience Before founding Rockefeller Treasury, Barbara worked at Citibank and other banks as a risk manager, new product developer (Cititrend), FX trader, advisor and loan officer. Miss Rockefeller is engaged to perform FX-relat


