What Goes Up [Video]
![What Goes Up [Video]](https://editorial.fxstreet.com/images/Markets/Commodities/Metals/Gold/safe-investment-gm147322399-17568598_XtraLarge.jpg)
US Dollar: March USD is Down at 96.990.
Energies: Feb'20 Crude is Down at 58.19.
Financials: The Mar'20 30 year bond is Up 16 ticks and trading at 158.13.
Indices: The March S&P 500 emini ES contract is 10 ticks Lower and trading at 3285.50.
Gold: The Feb'20 Gold contract is trading Up at 1552.90. Gold is 83 ticks Higher than its close.
Initial Conclusion
This is not a correlated market. The dollar is Down and Crude is Down which is not normal and the 30 year Bond is trading Higher. The Financials should always correlate with the US dollar such that if the dollar is lower then bonds should follow and vice-versa. The S&P is Lower and Crude is trading Lower which is not correlated. Gold is trading Higher which is correlated with the US dollar trading Down. I tend to believe that Gold has an inverse relationship with the US Dollar as when the US Dollar is down, Gold tends to rise in value and vice-versa. Think of it as a seesaw, when one is up the other should be down. I point this out to you to make you aware that when we don't have a correlated market, it means something is wrong. As traders you need to be aware of this and proceed with your eyes wide open.
At this time all of Asia is trading to the Downside. Currently all of Europe is trading Lower with the exception of the London exchange.
Possible Challenges To Traders Today:
-
PPI is out at 8:30 AM EST. This is Major.
-
Core PPI is out at 8:30 AM EST. This is Major.
-
Empire State Manufacturing Index is out at 8:30 AM EST. This is Major.
-
Crude Oil Inventories is out at 10:30 AM EST. This is Major.
-
FOMC Member Harker Speaks at 11 AM EST. This is Major.
-
FOMC Member Kaplan Speaks at 12 noon. This is Major.
-
Beige Book is out at 2 PM EST. This is Major.
Treasuries
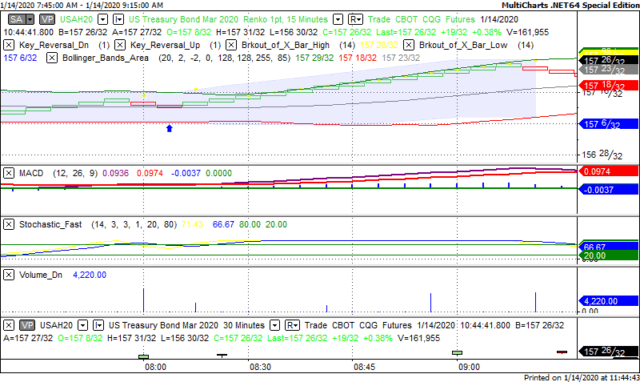
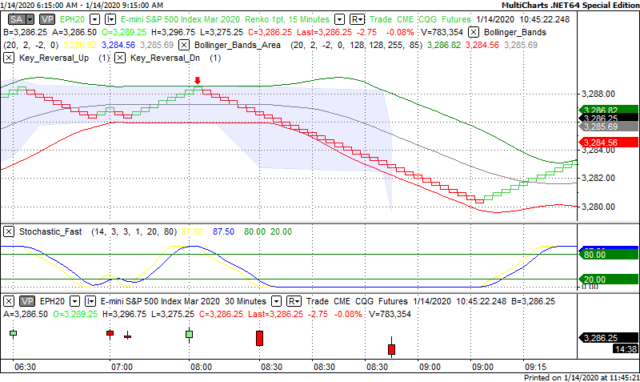
We've elected to switch gears a bit and show correlation between the 30 year bond (ZB) and The S&P futures contract. The S&P contract is the Standard and Poor's and the purpose is to show reverse correlation between the two instruments. Remember it's liken to a seesaw, when up goes up the other should go down and vice versa.
Yesterday the ZB made a major move at around 8 AM EST. The ZB hit a Low at around that time and the S&P moved Lower. If you look at the charts below ZB gave a signal at around 8 AM EST and the S&P moved Lower at the same time. Look at the charts below and you'll see a pattern for both assets. ZB hit a Low at around 8 AM and the S&P was moving Lower shortly thereafter. These charts represent the newest version of MultiCharts and I've changed the timeframe to a 15 minute chart to display better. This represented a Long opportunity on the 30 year bond, as a trader you could have netted about 12 ticks per contract on this trade. Each tick is worth $31.25. Please note: the front month for the ZB is now March '20. The S&P contract is also March '20. I've changed the format to Renko bars such that it may be more apparent and visible.
Charts Courtesy of MultiCharts built on an AMP platform
Bias
Yesterday we gave the markets a Downside bias as the USD, Crude and Bonds were all trading Higher and this is indicative of a Downside day, hence the Downside bias. The markets didn't fully cooperate as the Dow did squeak into positive territory within the last 10 minutes of trade but the S&P and Nasdaq both traded Lower. Today we aren't dealing with a correlated market and our bias is Neutral.
Could this change? Of Course. Remember anything can happen in a volatile market.
Commentary
It seems as though the markets are following an age old pattern whereby one day it trades up and the next day it falters. This is dangerous because it leads traders to believe that direction can be determined by this. It cannot. Each trading day is different with many different factors affecting it and change can happen at any time. It leads traders to have a false sense of security, where there shouldn't be. Yesterday we can CPI numbers and today we shall have PPI as well as some FOMC members speaking.
Author

Nick Mastrandrea
Market Tea Leaves


