What goes up, must come down

USD: Mar '24 is Down at 104.305.
Energies: Mar '24 Crude is Up at 73.21.
Financials: The Mar '24 30 Year T-Bond is Up 2 ticks and trading at 120.06.
Indices: The Mar '24 S&P 500 emini ES contract is 18 ticks Lower and trading at 4957.50.
Gold: The Feb'24 Gold contract is trading Down at 2042.40.
Initial conclusion
This is not a correlated market. The USD is Down and Crude is Up which is normal, but the 30 Year T-Bond is trading Higher. The Financials should always correlate with the US dollar such that if the dollar is Higher, then the bonds should follow and vice-versa. The S&P is Lower and Crude is trading Higher which is correlated. Gold is trading Lower which is not correlated with the US dollar trading Down. I tend to believe that Gold has an inverse relationship with the US Dollar as when the US Dollar is down, Gold tends to rise in value and vice-versa. Think of it as a seesaw, when one is up the other should be down. I point this out to you to make you aware that when we don't have a correlated market, it means something is wrong. As traders you need to be aware of this and proceed with your eyes wide open. Asia is trading mainly Higher with the exception of the Nikkei and Singapore exchanges which are Lower. All of Europe is trading Higher with the exception of the German Dax.
Possible challenges to traders
-
RCM/TIPP Economic Optimism - tentative. This is Major.
-
FOMC Member Mester Speaks at 12 Noon. This is Major.
Treasuries
Traders, please note that we've changed the Bond instrument from the 30 year (ZB) to the 10 year (ZN). They work exactly the same.
We've elected to switch gears a bit and show correlation between the 10-year bond (ZN) and the S&P futures contract. The S&P contract is the Standard and Poor's, and the purpose is to show reverse correlation between the two instruments. Remember it's likened to a seesaw, when up goes up the other should go down and vice versa.
Yesterday the ZN migrated Higher at around 11:30 AM EST as the S&P hit a High at around the same time. If you look at the charts below the S&P gave a signal at around 11:30 AM and the ZN started its Upward trend. Look at the charts below and you'll see a pattern for both assets. S&P hit a High at around 11:30 AM and migrated Lower. These charts represent the newest version of MultiCharts and I've changed the timeframe to a 15-minute chart to display better. This represented a Long opportunity on the 10-year note, as a trader you could have netted about 20 ticks per contract on this trade. Each tick is worth $15.625. Please note: the front month for the ZN is now Mar '24. The S&P contract is now Mar' 24. I've changed the format to filled Candlesticks (not hollow) such that it may be more apparent and visible.
Charts courtesy of MultiCharts built on an AMP platform
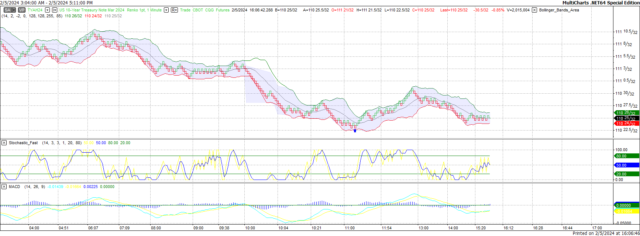
ZN - Mar 2024 - 02/05/24
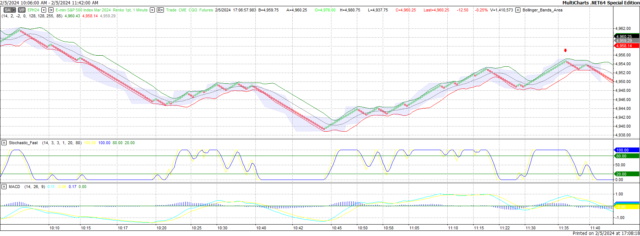
S&P - Mar 2024 - 02/05/24
Bias
Yesterday we gave the markets a Neutral bias as we saw no real evidence of Market Correlation Monday morning hence the Neutral or Mixed bias. The Dow dropped 274 points and the other indices lost ground as well. Once again, we're dealing with a Mixed market and will need to maintain a Neutral bias.
Could this change? Of Course. Remember anything can happen in a volatile market.
Commentary
After multiple days of an Upward climb the markets finally veered to the Downside which gives new meaning to the adage "what goes Up, must come Down" and the markets did that yesterday. The Dow dropped 274 points and the S&P and Nasdaq lost ground as well. Today we are light on economic news so there's really not much driving the markets. Yesterday the proposed fault lied with Chair Powell as he claimed the Fed was in no hurry to reduce rates. This is problematic at best because the markets are clamoring for interest rate reductions which will open the doors for more consumer spending and that's important as the US economy is 70% driven by consumer spending. Will the markets correct themselves today? Only time will tell...
Author

Nick Mastrandrea
Market Tea Leaves


