What Goes Up
US Dollar: Dec. USD is Down at 97.350.
Energies: Jan '19 Crude is Up at 52.14.
Financials: The Mar 30 year bond is Down 10 ticks and trading at 142.29.
Indices: The Dec S&P 500 emini ES contract is 53 ticks Higher and trading at 2654.50.
Gold: The Dec Gold contract is trading Up at 1249.50. Gold is 23 ticks Higher than its close.
Initial Conclusion
This is not a correlated market. The dollar is Down- and Crude is Up+ which is normal and the 30 year Bond is trading Lower. The Financials should always correlate with the US dollar such that if the dollar is lower then bonds should follow and vice-versa. The S&P is Higher and Crude is trading Higher which is not correlated. Gold is trading Up+ which is correlated with the US dollar trading Lower. I tend to believe that Gold has an inverse relationship with the US Dollar as when the US Dollar is down, Gold tends to rise in value and vice-versa. Think of it as a seesaw, when one is up the other should be down. I point this out to you to make you aware that when we don't have a correlated market, it means something is wrong. As traders you need to be aware of this and proceed with your eyes wide open.
At this hour all of Asia is trading to the Upside. At the current time all of Europe is trading Higher as well.
Possible Challenges To Traders Today
-
CPI m/m is out at 8:30 AM EST. This is major.
-
Core CPI m/m is out at 8:30 AM EST. This is major.
-
Crude Oil Inventories is out at 10:30 AM EST. Major.
-
10-y Bond Auction starts at 1 PM EST. This is major.
-
Federal Budget Balance is out at 2 PM EST. Major.
Treasuries
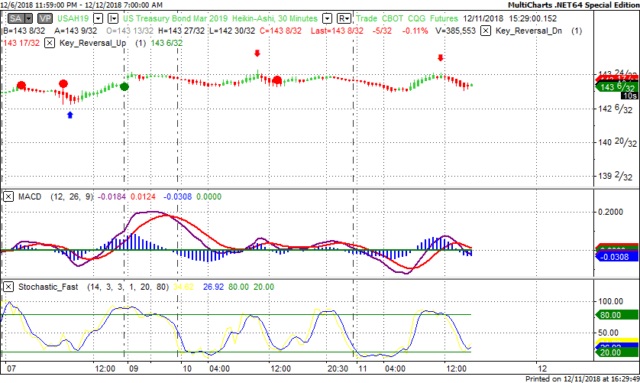
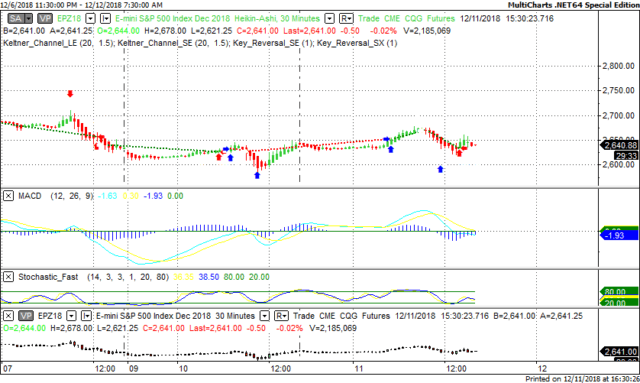
We've elected to switch gears a bit and show correlation between the 30 year bond (ZB) and The YM futures contract. The YM contract is the DJIA and the purpose is to show reverse correlation between the two instruments. Remember it's liken to a seesaw, when up goes up the other should go down and vice versa.
Yesterday the ZB made it's move at around 11:30 AM EST. The ZB hit a High at around that time and the YM hit a Low. If you look at the charts below ZB gave a signal at around 11:30 AM EST and the YM was moving Higher at the same time. Look at the charts below and you'll see a pattern for both assets. ZB hit a High at around 11:30 AM and the YM was moving Higher at the same time. These charts represent the newest version of MultiCharts and I've changed the timeframe to a 30 minute chart to display better. This represented a Shorting opportunity on the 30 year bond, as a trader you could have netted about 20 plus ticks per contract on this trade. Each tick is worth $31.25. Please note: the front month for the ZB contract is now March, 2019
Charts Courtesy of MultiCharts built on an AMP platform.
Bias
Yesterday we gave the markets a Neutral bias as it didn't seem as though the indices had any clear sense of direction. The Dow dropped 53 points, the S&P shed 1 and the Nasdaq gained 11. All in all a mixed or Neutral day. Today we aren't dealing with a correlated market and our bias is to the Upside.
Could this change? Of Course. Remember anything can happen in a volatile market.
Commentary
Yesterday we gave the markets a Neutral bias which means it could go in any direction. The Dow opened Higher but then went Lower and closed 53 points Lower. Today we have CPI and Core CPI; both of which are major and proven market movers. Additionally there was talk of a government shutdown due to border security issues between the Democrats and President Trump.
On Thursday, April 5th we had the honor and privilege to be interviewed by David Lincoln on his You Tube channel. David is a floor trader for the options markets. If you listen to this interview, you will enjoy it.
Author

Nick Mastrandrea
Market Tea Leaves


