What Goes Up

Good Morning Traders,
As of this writing 4 AM EST, here’s what we see:
US Dollar: Jun. USD is Up at 93.875.
Energies: Jun '18 Crude is Down at 71.78.
Financials: The June 30 year bond is Up 24 ticks and trading at 142.00.
Indices: The June S&P 500 emini ES contract is 56 ticks Lower and trading at 2711.50.
Gold: The June gold contract is trading Up at 1292.80. Gold is 8 ticks Higher than its close.
Initial Conclusion
This is not a correlated market. The dollar is Up+ and Crude is Down- which is normal and the 30 year Bond is trading Higher. The Financials should always correlate with the US dollar such that if the dollar is lower then bonds should follow and vice-versa. The S&P is Lower and Crude is trading Higher which is correlated. Gold is trading Up+ which is not correlated with the US dollar trading Up+. I tend to believe that Gold has an inverse relationship with the US Dollar as when the US Dollar is down, Gold tends to rise in value and vice-versa. Think of it as a seesaw, when one is up the other should be down. I point this out to you to make you aware that when we don't have a correlated market, it means something is wrong. As traders you need to be aware of this and proceed with your eyes wide open.
At this hour all of Asia is trading Lower. Europe is also trading completely to the Downside as well.
Possible Challenges To Traders Today
-
Flash Manufacturing PMI is out at 9:45 AM EST. Major
-
Flash Services PMI is out at 9:45 AM EST. This is major.
-
New Home Sales is out at 10 AM EST. This is major.
-
Crude Oil Inventories is out at 10:30 AM EST. This is major.
-
FOMC Meeting Minutes is out at 2 PM EST. This is major.
Treasuries
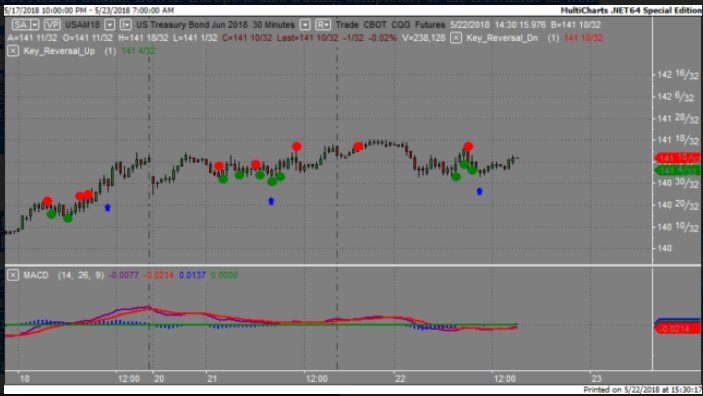
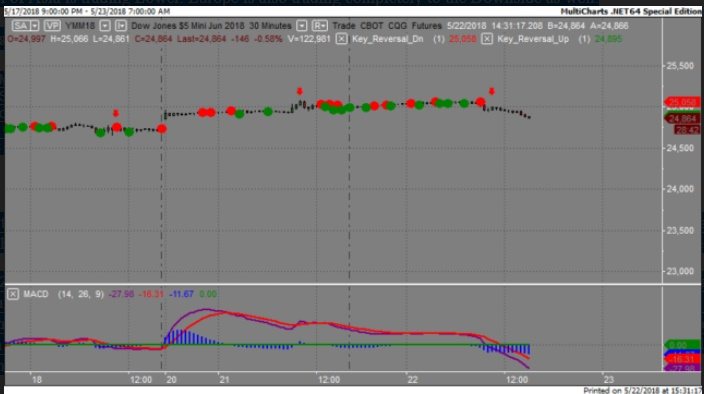
We've elected to switch gears a bit and show correlation between the 30 year bond (ZB) and The YM futures contract. The YM contract is the DJIA and the purpose is to show reverse correlation between the two instruments. Remember it's liken to a seesaw, when up goes up the other should go down and vice versa.
Yesterday the ZB made it's move at around 10:30 AM EST. The ZB hit a Low at around that time and the YM hit a High. If you look at the charts below ZB gave a signal at around 10:30 AM EST and the YM was moving Lower at the same time. Look at the charts below and you'll see a pattern for both assets. ZB hit a Low at around 10:30 AM and the YM was trending Lower at the same time. These charts represent the newest version of MultiCharts and I've changed the timeframe to a 30 minute chart to display better. This represented a long opportunity on the 30 year bond, as a trader you could have netted about a dozen ticks per contract on this trade. Each tick is worth $31.25.
Charts Courtesy of MultiCharts built on an AMP platform.
Bias
Yesterday we gave the markets an Upside bias as the Bonds and USD were both trading lower yesterday morning. The markets had other ideas as the Dow dropped 179 points and the other indices lost ground as well. Today we aren't dealing with a correlated market and our bias is to the Downside.
Could this change? Of Course. Remember anything can happen in a volatile market.
Commentary
Yesterday the news came out that the Trump Administration has stated that the upcoming and proposed meeting with North Korea "may not happen". The markets didn't take too kindly to this plus the fact that after Monday's run up, traders were more inclined to take money off the table. Today we have about 6 economic reports, all of which are major and proven market movers. Also the FOMC Meeting Minutes comes out at 2 PM this afternoon, so be mindful of that if trading.
Author

Nick Mastrandrea
Market Tea Leaves


