What Goes Up
US Dollar: Dec. USD is Up at 93.420.
Energies: Dec Crude is Up at 51.60.
Financials: The Dec 30 year bond is Down 36 ticks and trading at 152.13.
Indices: The Dec S&P 500 emini ES contract is 27 ticks Higher and trading at 2567.25.
Gold: The Dec gold contract is trading Down at 1281.00. Gold is 90 ticks Lower than its close.
Initial Conclusion
This is not a correlated market. The dollar is Up+ and Crude is Up+ which is not normal and the 30 year Bond is trading Higher. The Financials should always correlate with the US dollar such that if the dollar is lower then bonds should follow and vice-versa. The indices are Higher and Crude is trading Up+ which is not correlated. Gold is trading Down- which is correlated with the US dollar trading Up+. I tend to believe that Gold has an inverse relationship with the US Dollar as when the US Dollar is down, Gold tends to rise in value and vice-versa. Think of it as a seesaw, when one is up the other should be down. I point this out to you to make you aware that when we don’t have a correlated market, it means something is wrong. As traders you need to be aware of this and proceed with your eyes wide open.
At this hour all of Asia is trading Higher with the exception of the Indian Sensex exchange which is trading Lower. As of this writing all of Europe is trading Higher.
Possible Challenges To Traders Today
-
Existing Home Sales is out at 10 AM EST. This is major.
-
Federal Budget Balance. This is major.
-
Fed Chair Yellen Speaks at 7:30 PM EST. This is major.
Treasuries
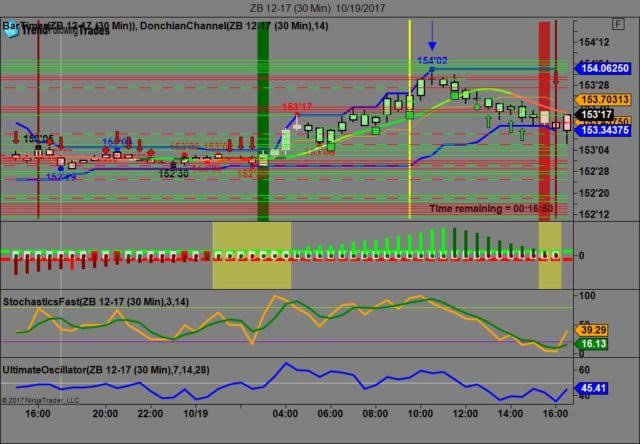
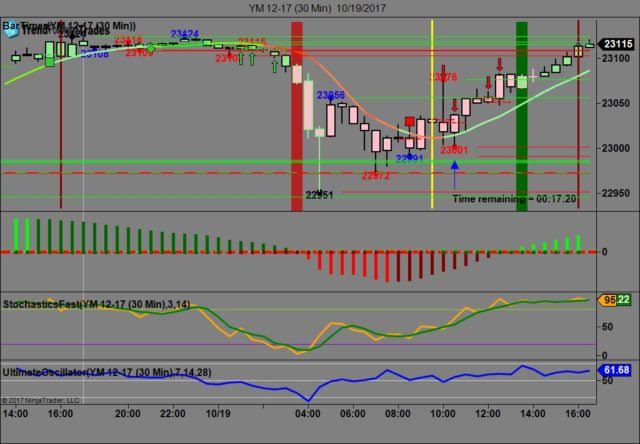
We’ve elected to switch gears a bit and show correlation between the 30 year bond (ZB) and The YM futures contract. The YM contract is the DJIA and the purpose is to show reverse correlation between the two instruments. Remember it’s liken to a seesaw, when up goes up the other should go down and vice versa.
Yesterday the ZB made it’s move at around 10:30 AM EST. The ZB hit a High at around that time and the YM hit a Low. If you look at the charts below ZB gave a signal at around 10:30 AM EST and the YM was moving Higher at the same time. Look at the charts below and you’ll see a pattern for both assets. ZB hit a High at around 10:30 AM and the YM hit a Low. These charts represent the newest version of Trend Following Trades and I’ve changed the timeframe to a 30 minute chart to display better. This represented a Shorting opportunity on the 30 year bond, as a trader you could have netted about 20 plus ticks per contract on this trade. Each tick is worth $31.25. We added a Donchian Channel to the charts to show the signals more clearly. Please note that the front month for the ZB and the YM contract is now December, 2017.
Charts Courtesy of Trend Following Trades built on a NinjaTrader platform.
Bias
Yesterday our bias was to the Downside as both the Bonds and Gold were trading Higher and that usually is indicative of a Downside day. The Dow rose 5 points, the S&P rose less than 1 point and the Nasdaq dropped by 19. Let’s be clear on this; the upside move on the Dow and S&P only happened within minutes of the closing bell. The rest of the session the indices were trading lower. Today we aren’t dealing with a correlated market and our bias is to the Upside.
Could this change? Of Course. Remember anything can happen in a volatile market.
Commentary
As we’ve stated previously what goes up must eventually and at some point retreat. This is the way of the markets and has been for centuries. The Dow and S&P regained upward momentum only within minutes of the closing bell, the Nasdaq remained in negative territory. A few weeks back we mentioned that President Trump would be speaking with Janet Yellen within a few weeks to discuss her future at the Federal Reserve. We are now of the opinion that Trump will not reappoint her and will choose a successor sooner as opposed to later. The question is will Trump allow Yellen to finish out her term will he “Apprentice” Yellen by terminating her immediately? This guy just loves to fire people. Only time will tell how it all plays out…
Author

Nick Mastrandrea
Market Tea Leaves


