What goes down [Video]
![What goes down [Video]](https://editorial.fxstreet.com/images/Markets/Commodities/Metals/Gold/gold-bars-50657756_XtraLarge.jpg)
US Dollar: Dec '20 USD Up at 94.025.
Energies: Nov'20 Crude is Up at 40.12.
Financials: The Dec '20 30 year bond is Down 5 ticks and trading at 176.17.
Indices: The Dec S&P 500 emini ES contract is 68 ticks Higher and trading at 3316.25.
Gold: The Dec'20 Gold contract is trading Down at 1892.60 Gold is 150 ticks Lower than its close.
Initial Conclusion
This is not a correlated market. The dollar is Up+ and Crude is Up+ which is not normal and the 30 year Bond is trading Lower. The Financials should always correlate with the US dollar such that if the dollar is lower then bonds should follow and vice-versa. The S&P is Higher and Crude is trading Higher which is not correlated. Gold is trading Lower which is correlated with the US dollar trading Up. I tend to believe that Gold has an inverse relationship with the US Dollar as when the US Dollar is down, Gold tends to rise in value and vice-versa. Think of it as a seesaw, when one is up the other should be down. I point this out to you to make you aware that when we don't have a correlated market, it means something is wrong. As traders you need to be aware of this and proceed with your eyes wide open.
Asia is trading mainly Higher at this time with the exception of the Japanese Nikkei and the Indian Sensex exchanges which are Lower. Currently all of Europe is trading to the Upside.
Possible Challenges To Traders Today:
-
FOMC Member Mester Speaks at 9 AM EST. This is Major.
-
HPI m/m is out at 9 AM EST. This is Major.
-
Flash Manufacturing PMI is out at 9:45 AM EST. This is Major.
-
Flash Services PMI is out at 9:45 AM EST. This is Major.
-
Fed Chair Powell Testifies at 10 AM EST. This is Major.
-
Crude Oil Inventories is out at 10:30 AM EST. This is Major.
-
FOMC Member Quarles Speaks at 2 PM EST. This is Major.
Treasuries
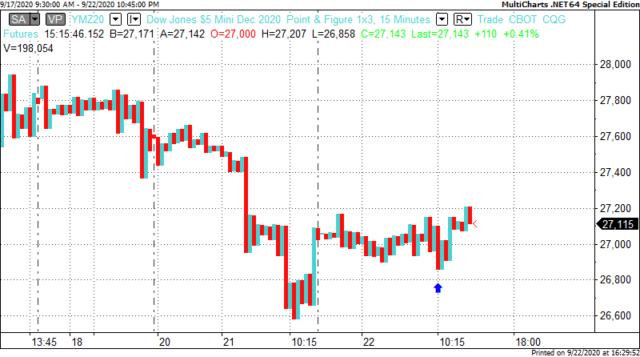
We've elected to switch gears a bit and show correlation between the 30 year bond (ZB) and The S&P futures contract. The S&P contract is the Standard and Poor's and the purpose is to show reverse correlation between the two instruments. Remember it's liken to a seesaw, when up goes up the other should go down and vice versa.
Yesterday the ZB made it's move at around 10:15 AM EST. The ZB hit a High at around that time and the Dow moved Higher. If you look at the charts below ZB gave a signal at around 10:15 AM EST and the Dow moved Higher at around the same time. Look at the charts below and you'll see a pattern for both assets. ZB hit a High at around 10:15 AM EST and the Dow was moving Higher shortly thereafter. These charts represent the newest version of MultiCharts and I've changed the timeframe to a 15 minute chart to display better. This represented a Shorting opportunity on the 30 year bond, as a trader you could have netted about 20 ticks per contract on this trade. Each tick is worth $31.25. Please note: the front month for the ZB is now Dec '20. The S&P contract is also Dec '20 as well. I've changed the format to Renko bars such that it may be more apparent and visible.
Charts Courtesy of MultiCharts built on an AMP platform
Bias
Yesterday we gave the markets a Neutral bias as we really didn't see much in the way of Market Correlation yesterday morning. The Dow gained 140 points and the other indices gained ground as well. Today we aren't dealing with a correlated market and our bias is to the Upside.
Could this change? Of Course. Remember anything can happen in a volatile market.
Commentary
After 4 consecutive l and our bias is to the Upside osing sessions in a row the markets did an about face yesterday and decide to migrate to the Upside. Did the Fed Chairman testimony do anything to propel this? I don't think so. I think the smart money decided to take the markets to the Upside as they saw more potential in that direction. Today the Fed Chair will testify again and the question is does what he says move the markets? Only time will tell....
Author

Nick Mastrandrea
Market Tea Leaves


