We’re back and the markets didn’t wait for us


After a short break, the Lab is back, and the markets definitely didn’t sit still while we were away.
Across metals, the dollar, and equities, several earlier breakouts have already been challenged or invalidated, while fresh gaps are giving us a new set of levels to work with. Rather than trying to reconstruct every candle we missed, we’re doing what we always do: checking which of our previous scenarios are still alive, which ones are no longer valid, and mapping the levels that matter next.
A lot can happen in a week.
Let’s get straight to the charts.
Dollar (DX.F) - Bears take back control
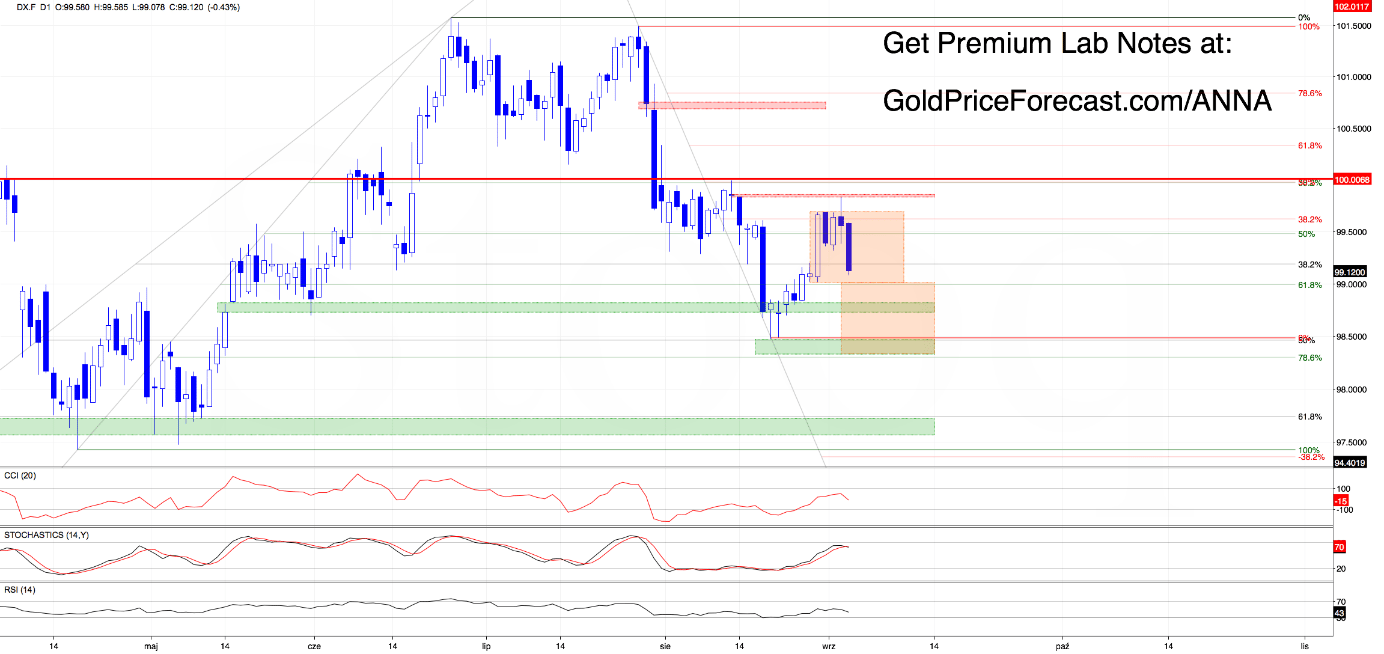
Although last week brought a stronger dollar and a weekly close above the 38.2% Fibonacci retracement based on the July 28-August 20 decline, the bulls failed to close the bearish gap at 99.83-99.85.
Yesterday, the greenback closed back below the previously broken Fibonacci level, invalidating the earlier breakout.
And the bears didn’t waste much time taking advantage of it.
The dollar has now started correcting the previous bullish move, putting the lower boundary of the orange consolidation around 99 back into focus.
What happens next?
Our next downside target is the lower boundary of that consolidation around 99, and this is likely where the next directional decision will be made.
Bullish scenario: if buyers regain control, reclaim the 38.2% Fibo, and push higher again, the next target will be the upper boundary of the consolidation at 99.68.
Bearish scenario: a break below 99 would open the door toward 98.72-98.83.
If sellers manage to close the May 15 gap, however - remember, this exact area stopped them in August and triggered the previous move north - the next target would become the support zone around the 50% and 78.6% Fibo at 98.30-98.46, which also lines up with the measured move based on the height of the orange consolidation.
Takeaway
Watch 99 closely. A successful defense keeps the dollar inside the broader consolidation and gives buyers another shot at 99.68. A clean break below 99 shifts the focus to 98.72-98.83, followed by 98.30-98.46 if that support fails.
Silver (SI.F) - Buyers defend support and keep 7000 in play
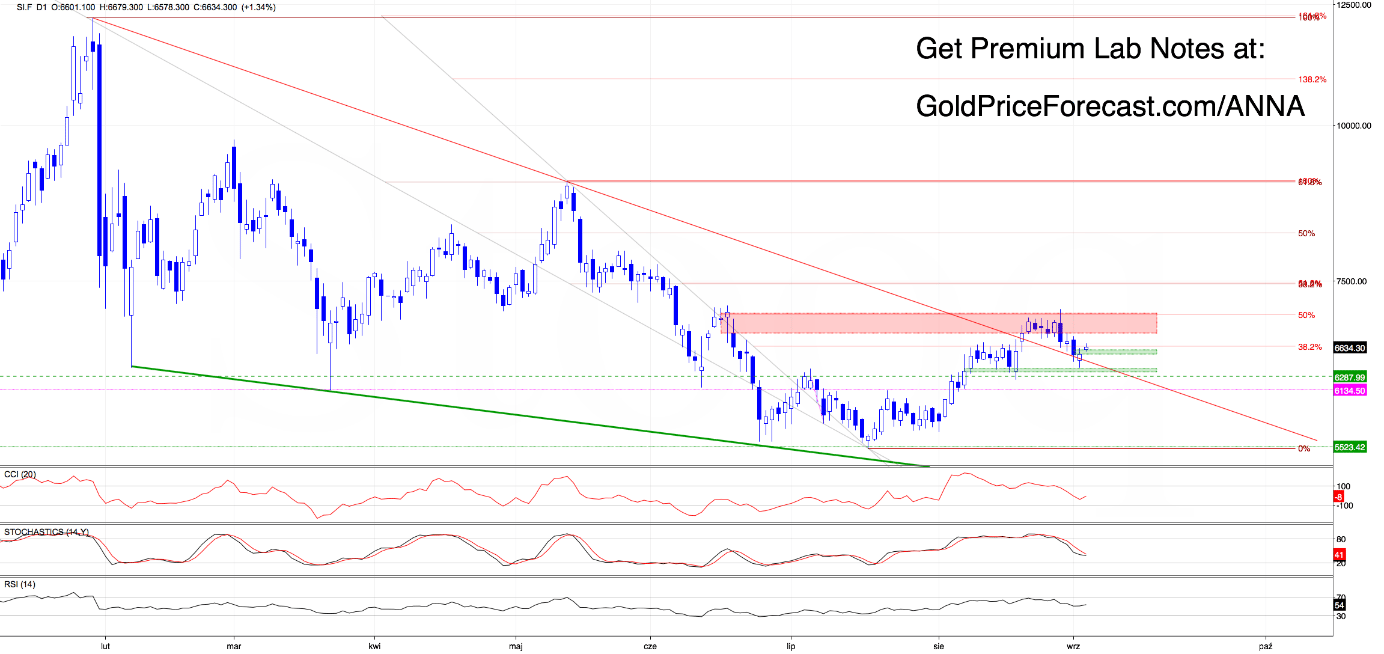
Despite Friday’s rally and an attack on the bearish gap at 6804-7076, the resistance zone remained unconquered. That quickly triggered a correction of the previous advance.
This week, sellers extended the decline and retested the previously broken red declining trend line (the upper boundary of the multi-month falling wedge) exactly in line with our scenario from last week.
What happens next?
Yesterday’s price action showed that the bullish gap at 6349-6380 continues to work effectively as support.
Combined with an invalidation of the earlier tiny intraday breakdown under the mentioned red line, that defense produced another bullish gap at the start of today’s Asian session at 6546-6601, giving buyers another solid technical argument.
In other words, as long as the daily close remains above the red declining trend line - which now acts as support - the road toward another attack on 7000 and the bearish gap at 6804-7076 remains open.
Takeaway
Watch the red trend line and the bullish gaps at 6546-6601 and 6349-6380. As long as buyers keep defending this structure on a daily closing basis, another run toward 7000 and 6804-7076 remains in play.
Nasdaq 100 E-Mini (NQ.F) - The bullish gap keeps the door open
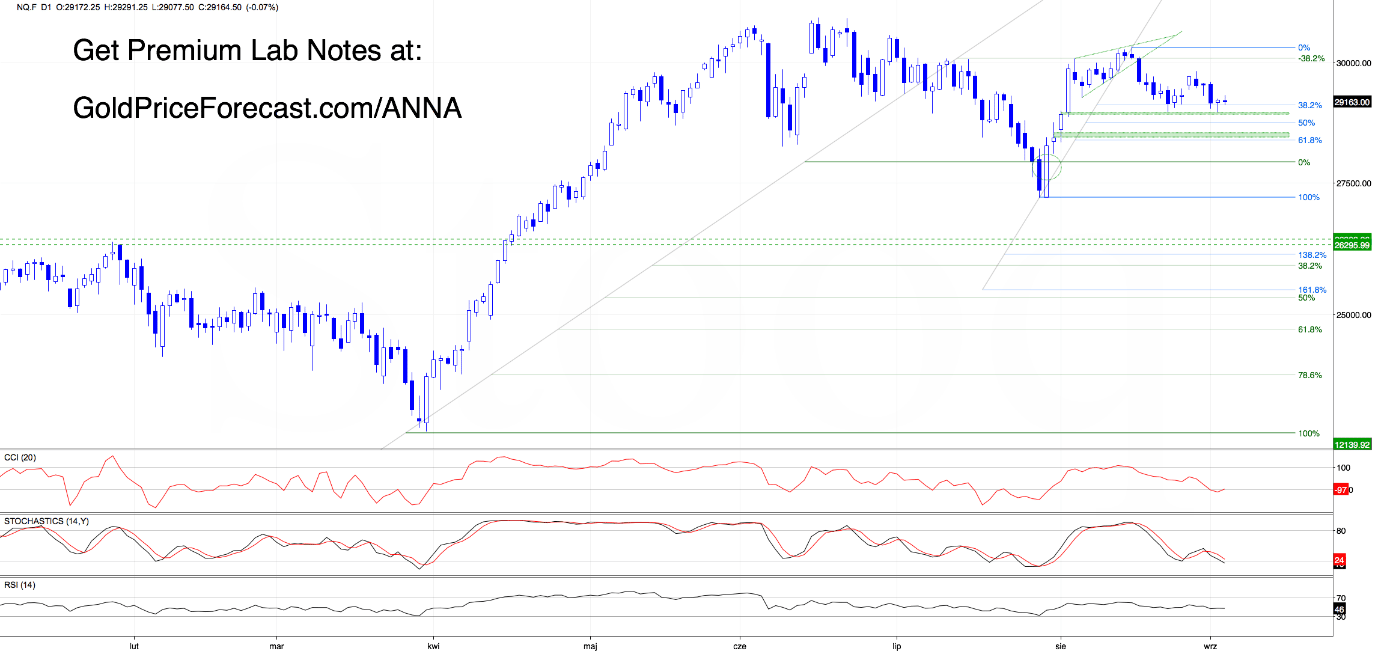
Last week brought a correction of the previous rally, but one important support survived the entire move: the August 4 bullish gap at 28891-28930, which once again absorbed the selling pressure.
What happens next?
In our view, as long as this gap remains open, the bulls are still in the game and have a solid technical base for another move north.
If that scenario plays out, the first target will likely be Friday’s high at 29811. A successful breakout above that level would then put the psychological 30000 barrier in focus.
What invalidates the bullish scenario? A daily close below 28891.
Takeaway
Watch 28891-28930. As long as this bullish gap remains open, buyers retain the advantage and 29811 stays in play. A break above that high opens the road toward 30000, while a daily close below 28891 invalidates the bullish setup.
Coffee - ICE (KC.F): The range finally cracks
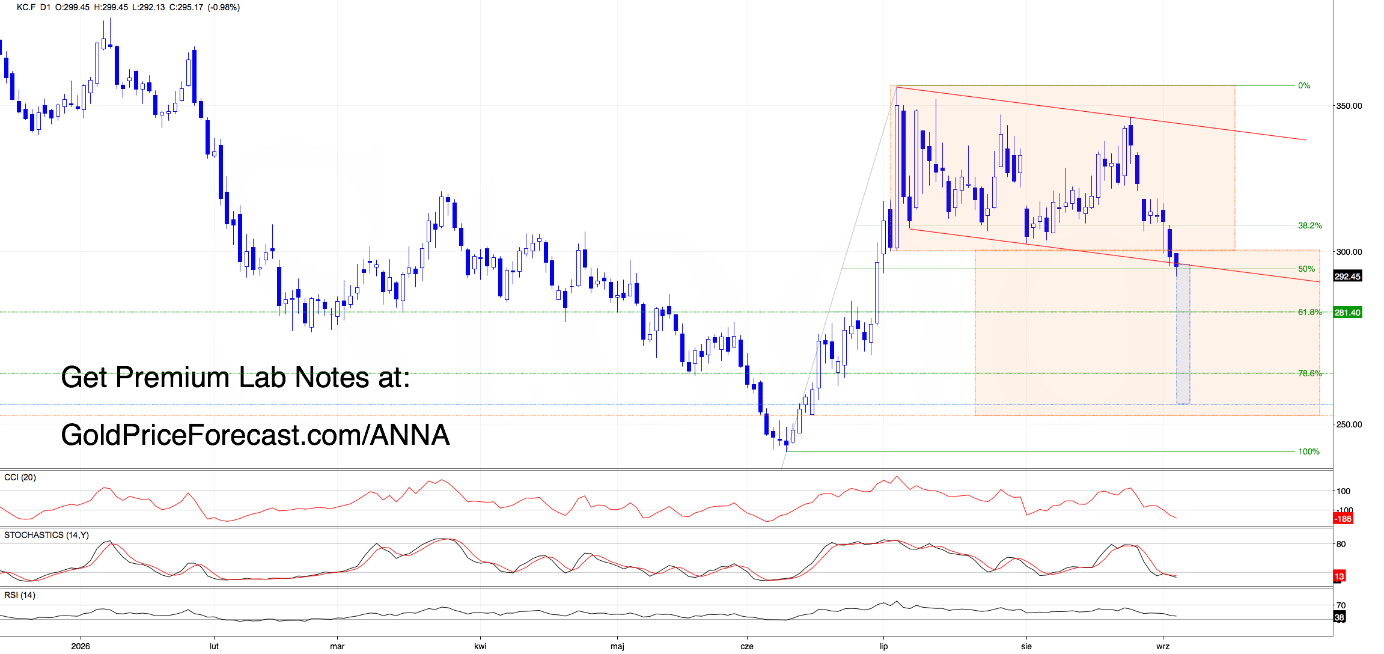
Two things immediately stand out on the Coffee chart: the orange consolidation at 300.20-357, which had been holding since July 7, and the red declining channel.
Yesterday brought a major technical development.
The bears closed the day below the lower boundary of the orange consolidation, suggesting that another leg lower could be just around the corner. At the same time, Coffee tested the lower boundary of the red declining channel and the 50% Fibo.
What happens next?
If sellers close the day below the lower boundary of the red channel, the road south would open considerably.
The first downside level to watch would be 281.40, the 61.8% Fibo.
If that support breaks as well, the next bearish targets become 263.73 and potentially the 252.30-255.20 zone, where the measured moves based on the height of both the orange consolidation and the red declining channel come into play.
What invalidates the bearish scenario? A daily close back above 300.20, which would invalidate the earlier breakdown below the lower boundary of the orange consolidation.
Takeaway
Watch the lower boundary of the red declining channel. A daily close below it keeps the bearish scenario alive and puts 281.40 in focus, followed by 263.73 and 252.30-255.20 if the decline accelerates. A daily close above 300.20 invalidates the earlier breakdown from the orange consolidation.
Thursday cheat sheet - Everything that matters
Dollar (DX.F)
Watch: 99
Bullish: Reclaim 38.2% Fibo → 99.68
Bearish: Break below 99 → 98.72-98.83 → potentially 98.30-98.46
Silver (SI.F)
Watch: Red declining trend line + 6546-6601
Bullish: Hold above the red line → 7000 / 6804-7076
Deeper support: 6349-6380
Nasdaq 100 E-Mini (NQ.F)
Watch: 28891-28930
Bullish: Gap holds → 29811 → break higher opens 30000
Invalidation: Daily close below 28891
Coffee - ICE (KC.F)
Watch: Lower boundary of red declining channel
Bearish: Close below → 281.40 → 263.73 → 252.30-255.20
Invalidation: Daily close above 300.20
Stay patient, respect the levels, and let the market show its hand before committing fresh risk.
Want free follow-ups to the above article and details not available to 99%+ investors? Sign up to our free newsletter today!
Author

















