Americans have never felt this broke, and the stock market is at a record. Both are true
The University of Michigan's consumer sentiment index was 48 for October, the second-lowest reading since 1952, and the S&P 500 is within 2% of a record. The rule that record gloom precedes a 20% rally only worked after a crash, and there hasn't been one.
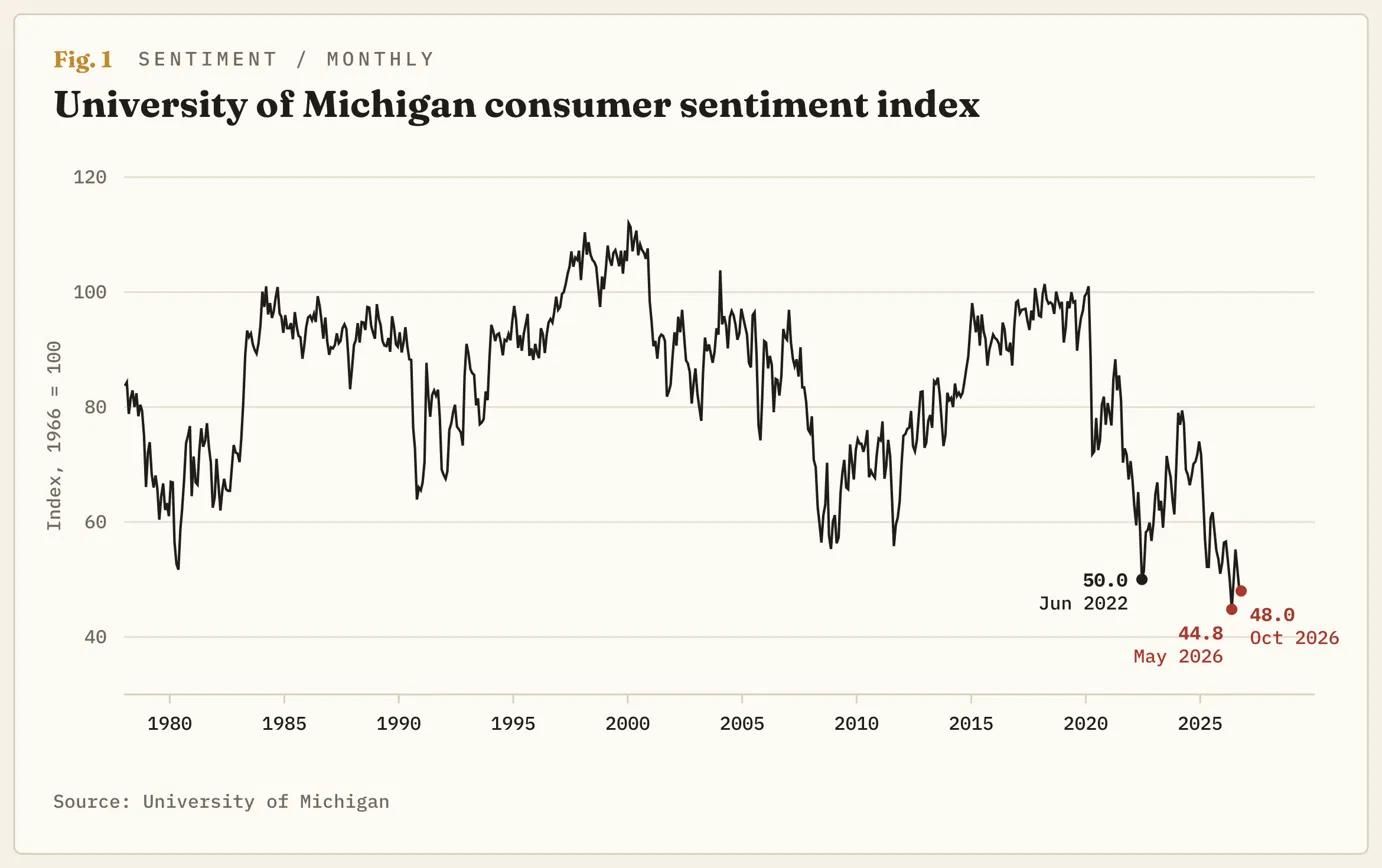
The University of Michigan (UoM) published its final October sentiment reading on Friday: 48, a tenth below September and the second-lowest in the 74 years it has asked the question. The survey's five lowest readings have all come this year, with May's 44.8 at the bottom. The S&P 500 set a record close on October 6 and is trading about 2% below it. On May 29, the last trading day of the survey's worst month, it also closed at a record. The two facts don't contradict each other because the survey respondents and the index owners are, for the most part, different.
The preliminary October release on October 9 reported a record low for current conditions, 44.7. The final figure is 46.7, so the record lasted a fortnight, and May's 45.8 keeps it. Households expect 4.7% inflation over the next year, against 3.4% in February, before the war, and the survey's director, Joanne Hsu, wrote that purchasing power "continues to dominate consumer views of the economy".
The buy signal was the crash, not the mood
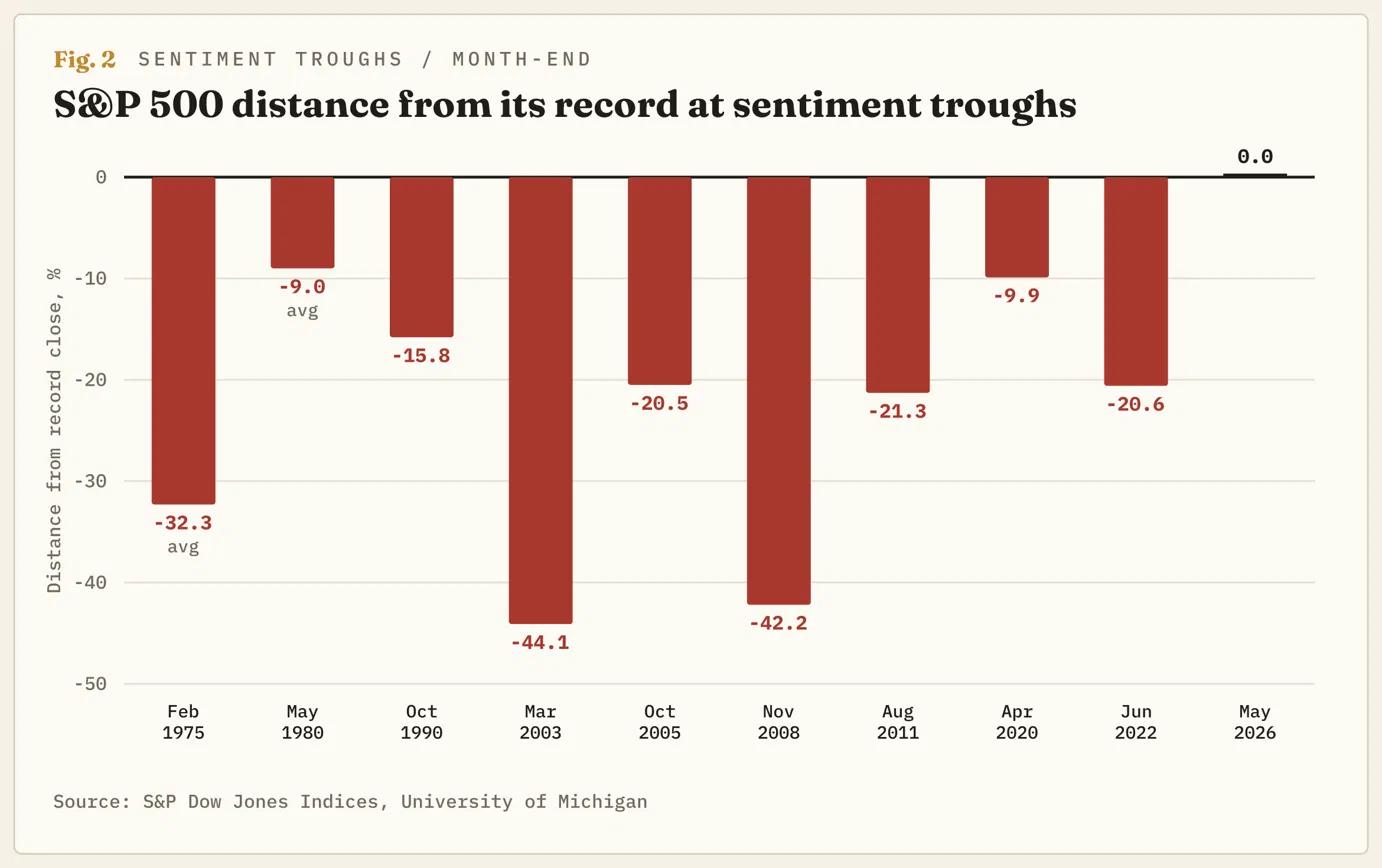
JPMorgan Asset Management's Guide to the Markets gives most readers the answer. After nine sentiment troughs since the 1970s, the S&P 500 returned an average of 24.1% over the following 12 months, against 4.8% after ten sentiment peaks. The figures hold. The slide doesn't show where the index stood at each trough. In February 1975, it was 32% below its record. In May 1980 it was 9% below; in October 1990, 16%; in March 2003, 44%; in October 2005, 21%; in November 2008, 42%; in August 2011, 21%; in April 2020, 10%; in June 2022, 21%. The average distance from the trough record was 24%, which is also what the index made the year after.
In May 2026, the distance was zero. Five months after the 1990, 2003, 2011, and 2022 troughs, the index was up 8-23%, and five months after May it was up 1%. Every previous trough measured a market that had already fallen, and the following year was the recovery. Buying while everyone was miserable worked because everyone was miserable about a crash.
Different Americans
The Federal Reserve's (Fed) distributional accounts put 86% of Americans' stock ownership with the richest tenth of households and 2% with the poorer half. The UoM survey counts each household once, so its index mostly reflects the views of people who own little or no stock. The survey's September tables show how far apart the two groups are. Asked what they would do over the next year about items whose prices have risen a lot, half of the top third of stockholders said they would keep spending as usual. Among households with no stock, 18% said the same and 26% said they would stop buying those items altogether. In August, the latest month the survey has been split by income, sentiment was 44.6 in the bottom third of earners and 60 in the top third. The survey asks everyone and the index counts only the money, so one reports on the many and the other on the few.
Gloom about prices, not jobs
Six of the nine troughs on JPMorgan's list came during or just after a recession, with unemployment at or near its peak. The other three, October 2005, August 2011 and June 2022, each came with the index about 21% below its record. This one has neither. Initial jobless claims were 194K in the week to October 17. The Atlanta Fed's tracker has third-quarter growth at 3.6% ahead of the October 29 first estimate. S&P Global's October flash composite Purchasing Managers’ Index (PMI), a survey of company buyers, was 57.6, down from September's five-year high of 58.4. September payrolls grew 29K, the one number on the jobs side that fits the mood. The mood is about prices and the cost of borrowing. Hsu wrote that the fall in current conditions was entirely buying conditions for durables, which "plunged 18% on the basis of higher interest rates and rising concerns about the affordability of such purchases".
June 2022 was also about prices, with gasoline above $5, and the index was 21% below its record then because the Fed was on its way from zero to above 4%. The Fed is already near 4%, having raised rates on September 16. It meets again on October 28, and most of its committee is expected to raise rates again by the end of the year. The Fed is trying to produce a household that has stopped buying a car or a sofa because of borrowing costs, and the survey's willingness-to-buy gauge fell 18% in a month.
Where the mood does show up in the index
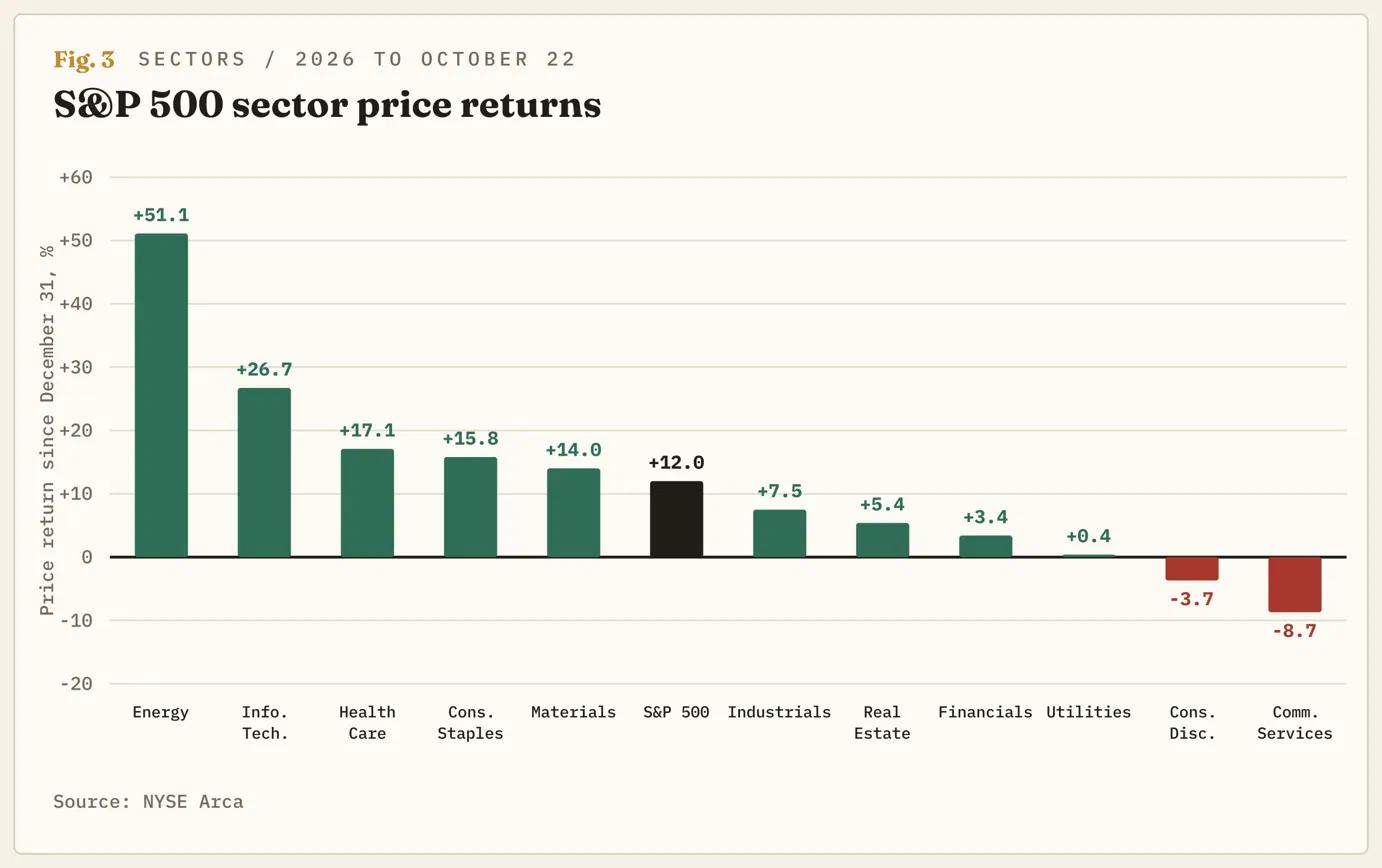
The index's year belongs to two sectors. Measured by the exchange-traded funds (ETFs) that track each sector, Energy is up 51% in 2026 on Oil above $100, and technology is up 27% on the AI build. Consumer Discretionary, the sector of carmakers, retailers, and restaurants, is down 3.7%, the only sector in the red apart from Communication Services. Since May 29, the day the record and the record low coincided, the index is up 1%, Energy is up 20%, and Consumer Discretionary is down 5%. The survey has long been a working indicator for companies that depend on the people it surveys, and the index at a record is the sum of the companies that don't.
The map
The S&P 500 has given back about half of the leg from the September low to the October 6 record, and Thursday's close was the first under the 50-day average since September. The daily Stochastic Relative Strength Index (Stoch RSI), a momentum gauge, has turned down from near 70 to the middle of its range, so the pullback was running before the sentiment number. Since the March low, the pattern has been higher lows above a rising 50-day average, under a 7,800 ceiling that held in August and gave way for two weeks in October. 7,700 is the line, because the 50-day average is there.
The lean is lower below 7,700 on a closing basis. The first test is 7,500, the September low and the last higher low in the run, and a close below it is the first lower low since March. The 200-day average near 7,300 puts the index 7% off its record, still less than at any trough on JPMorgan's list. The case is wrong on a daily close above 7,800, which would resume the record run on Energy and technology earnings, with the consumer no more involved than before. The survey isn't the trigger either way. The next reading is November 6, and the thing most likely to lift it, falling gasoline, is the same thing that would cut the Energy sector's 51%.
Author

Joshua Gibson
FXStreet
Joshua joins the FXStreet team as an Economics and Finance double major from Vancouver Island University with twelve years' experience as an independent trader focusing on technical analysis.