Weekly waves: GBP/USD, Bitcoin and gold
-
The GBP/USD downtrend is approaching the lows of the years 2016 and 2020. Let’s review if the Cable can break the double bottom for a new lower low.
-
Bitcoin (BTC/USD) is showing a semi bullish daily candlestick pattern on Friday. Let’s review whether there is any reversal potential.
-
The Gold chart (XAU/USD) is showing a bearish correction at the moment. Let’s review how deep can the bears push it before finding support.

GBP/USD bears aiming at double bottom
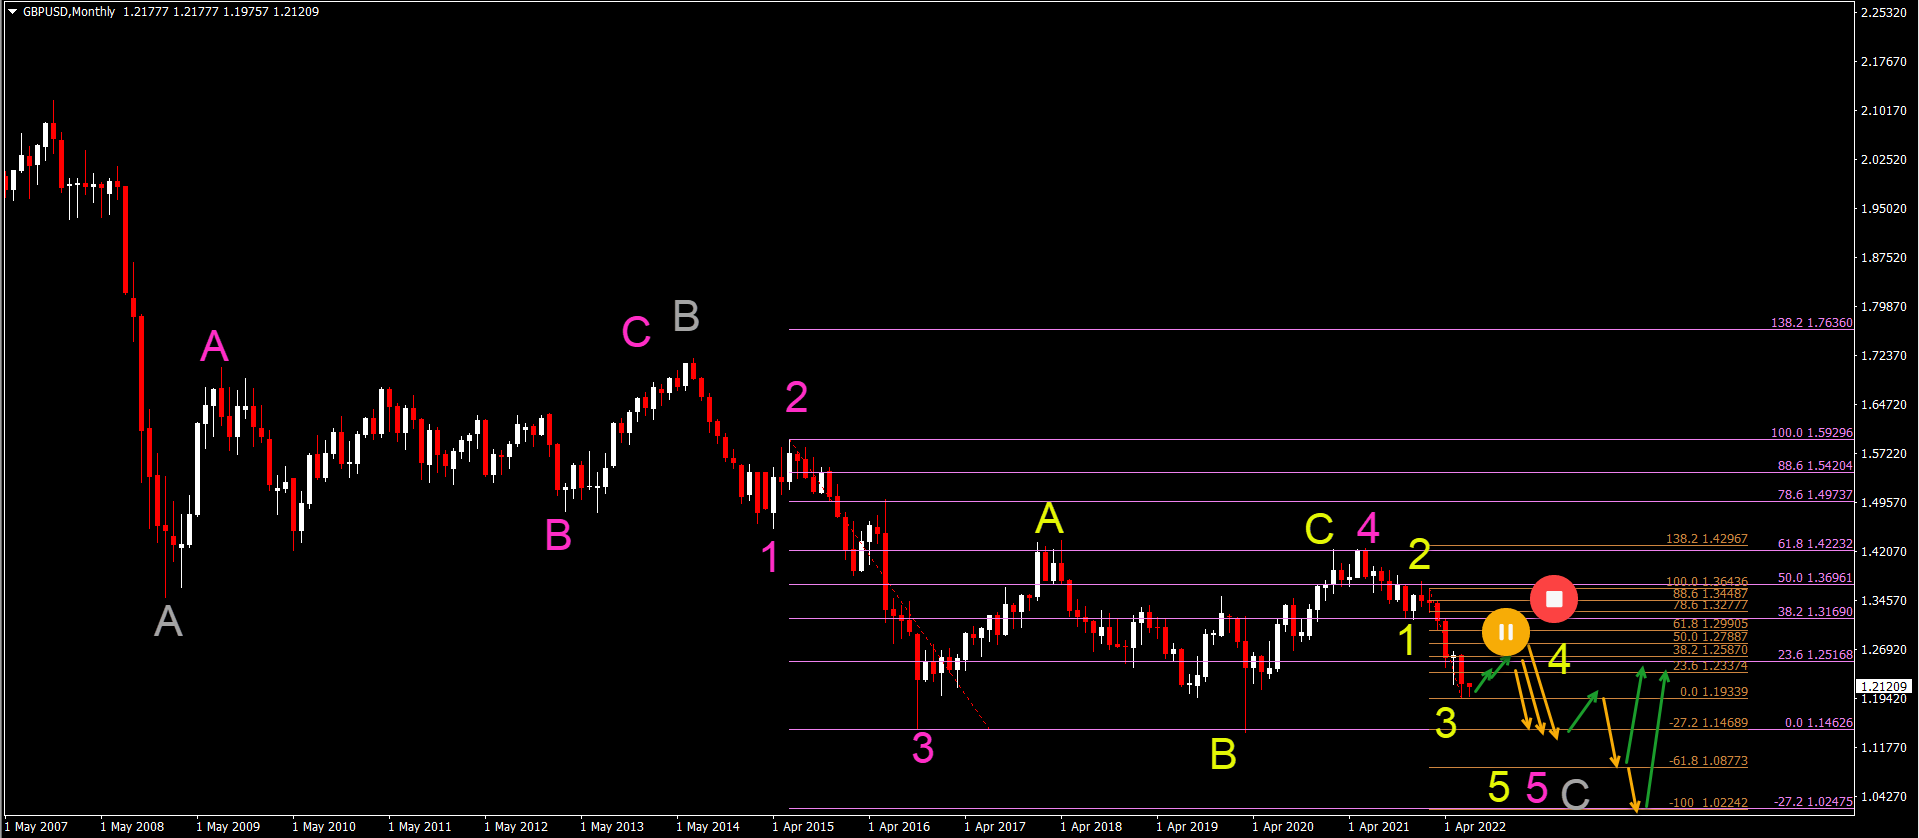
The GBP/USD downtrend is approaching the lows of the years 2016 and 2020. Let’s review if the Cable can break the double bottom for a new lower low:
-
The GBP/USD seems to be moving lower in a bearish impulse, which is probably a wave 3 of some sort (marked as yellow).
-
A bullish retracement is expected within a wave 4 (yellow) once the bearish wave 3 (yellow) has been completed.
-
The Fibonacci retracement levels (brown) will act as a resistance zone. Especially the 23.6-50% Fibonacci levels.
-
A break above the 50% Fib places the bearish analysis on hold whereas a deeper push up can even invalidate it.
-
A bearish continuation (orange arrows) should take place after the wave 4 (yellow) is completed.
-
The bearish wave 5 (yellow) should aim at the double bottom and could even go further down towards the FIbonacci targets.
-
The downtrend could complete a wave 5 (pink) of wave C (gray), after which a bullish reversal could take place (green arrows).
BTC/USD bullish reversal expected within wave B
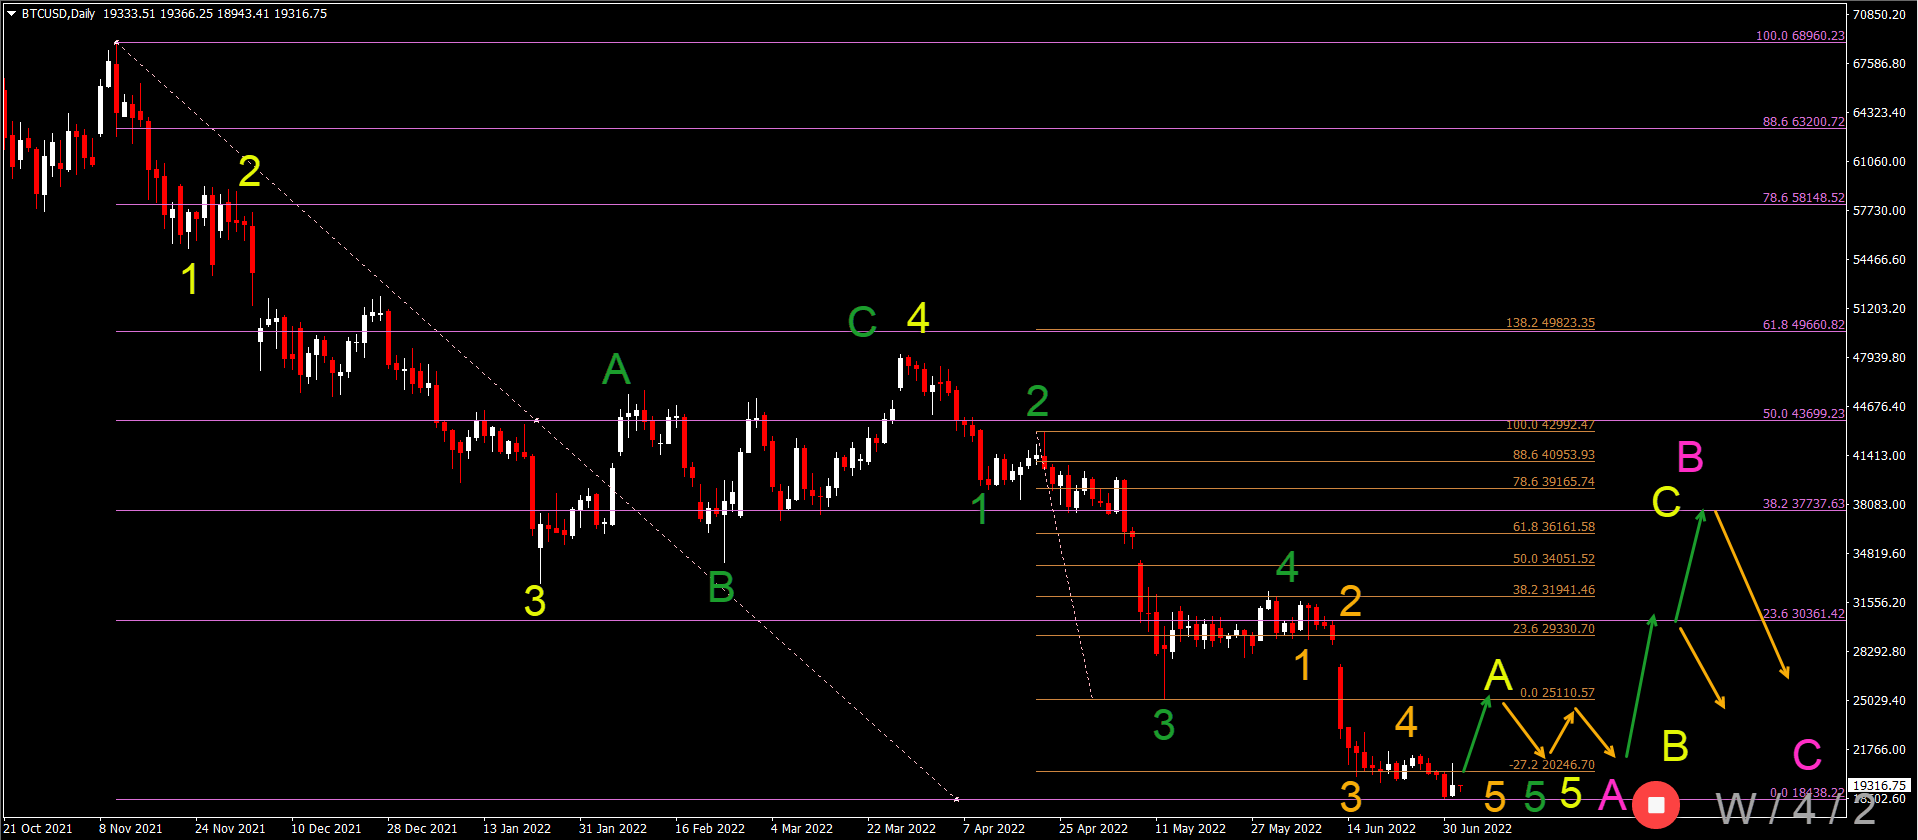
Bitcoin (BTC/USD) is showing a semi bullish daily candlestick pattern on Friday. Let’s review whether there is any reversal potential:
-
The BTC/USD seems to have completed a 5 wave pattern (orange) with the most recent low.
-
The bullish daily candlestick pattern could be a first signal that a bullish retracement is coming soon.
-
The 5 wave (orange) could also complete a wave 5 (green) of wave 5 (yellow) of wave A (pink).
-
An ABC (yellow) could emerge within a wave B (pink).
-
The main targets for the wave B (pink) are at the 23.6% and 38.2% Fibonacci retracement levels.
-
A deeper bullish retracement is not expected at the moment but this could change if price action starts to behave very bullishly.
-
After completing a wave B (pink), a new bearish swing within wave C (pink) is expected to take price lower again and create a new low to complete an ABC zigzag (pink).
Gold bears should see reversal soon
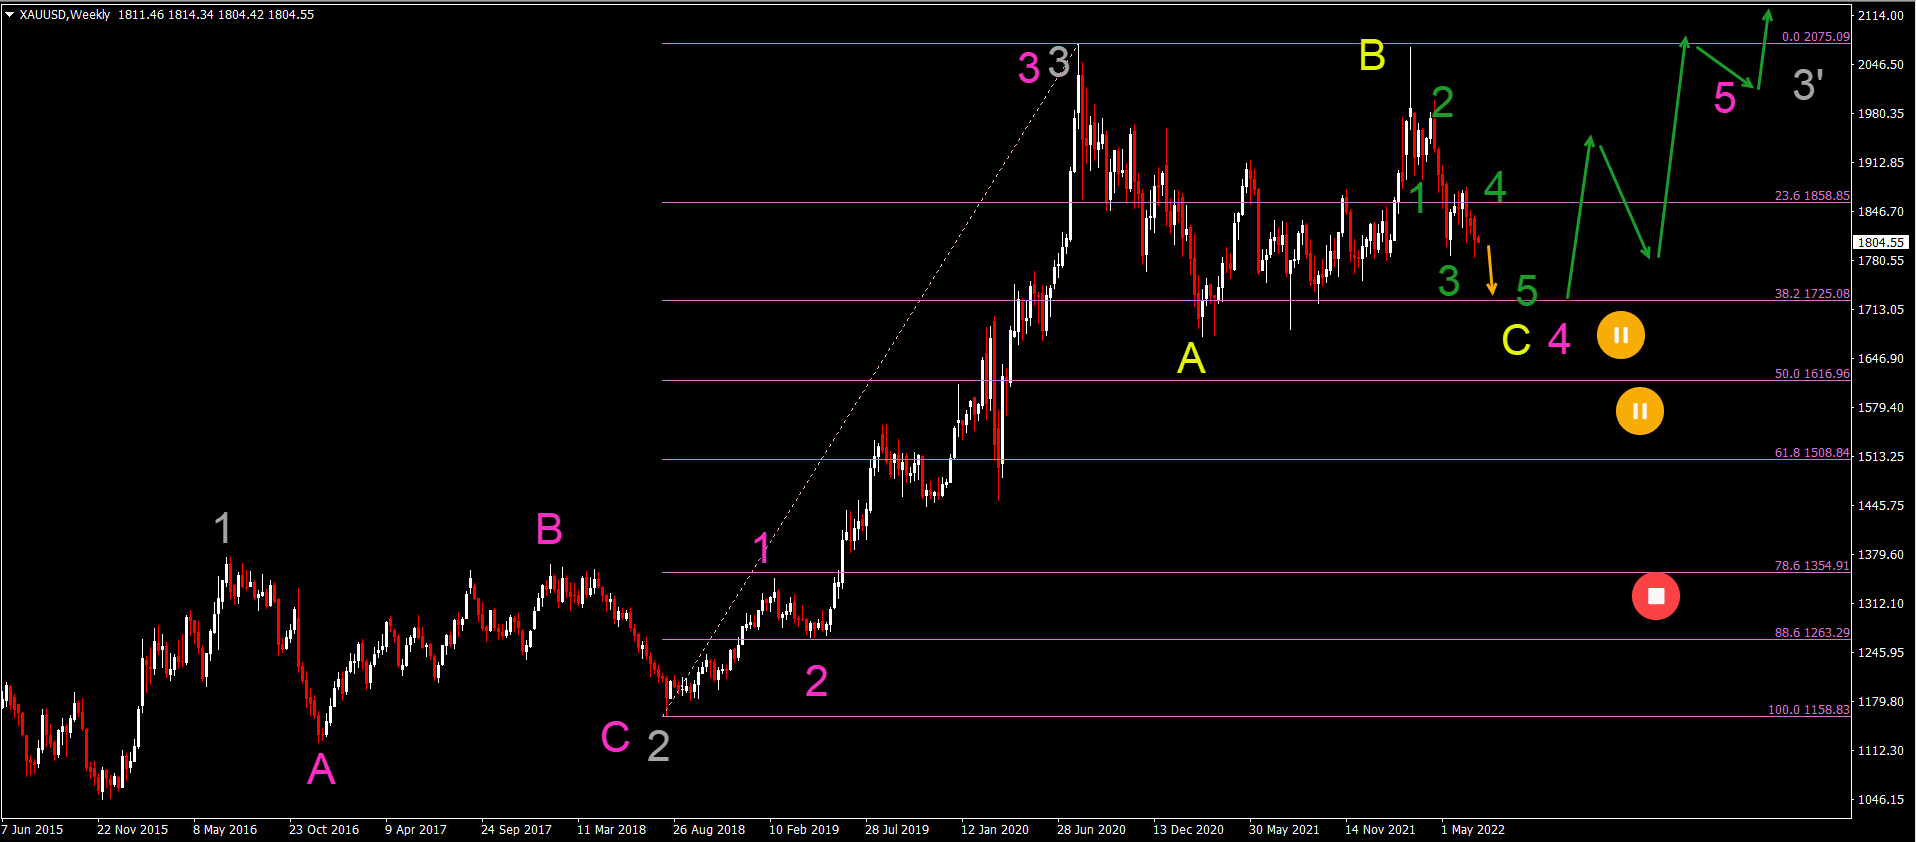
The Gold chart (XAU/USD) is showing a bearish correction at the moment. Let’s review how deep can the bears push it before finding support:
-
The Gold weekly chart is seeing a bearish impulse develop within a wave 5 (green) of wave C (yellow) of wave 4 (pink).
-
The bears are therefore not expected to keep control for all too long, even though a wave 4 can be choppy and lengthy.
-
Eventually, price action should turn around at the support zones and Fibonacci levels for a bullish reversal.
-
This bullish impulse could signal that the wave 4 (pink) is completed and that a wave 5 (pink) has started.
-
This could be either part of a wave 5 (gray) or even still part of a wave 3’ (gray).
The analysis has been done with the indicators and template from the SWAT method simple wave analysis and trading. For more daily technical and wave analysis and updates, sign-up to our newsletter
Author

Chris Svorcik
FS method
Chris Svorcik is a trader, analyst, and educator with over 15 years of experience in financial markets, specializing in moving averages, market structure, and price patterns.


