Weekly waves: EUR/USD, Gold and Bitcoin
-
Our weekly Elliott Wave analysis reviews the EUR/USD 4 hour chart, the Gold weekly chart, and the Bitcoin cryptocurrency daily chart.
-
The EUR/USD made a bearish bounce at the 38.2% Fibonacci retracement level. The break below the previous bottom could be part of a complex wave 4.
-
Even though price action could make a bullish bounce at the previous bottom, the price action looks too bearish for any rally to succeed at this moment.

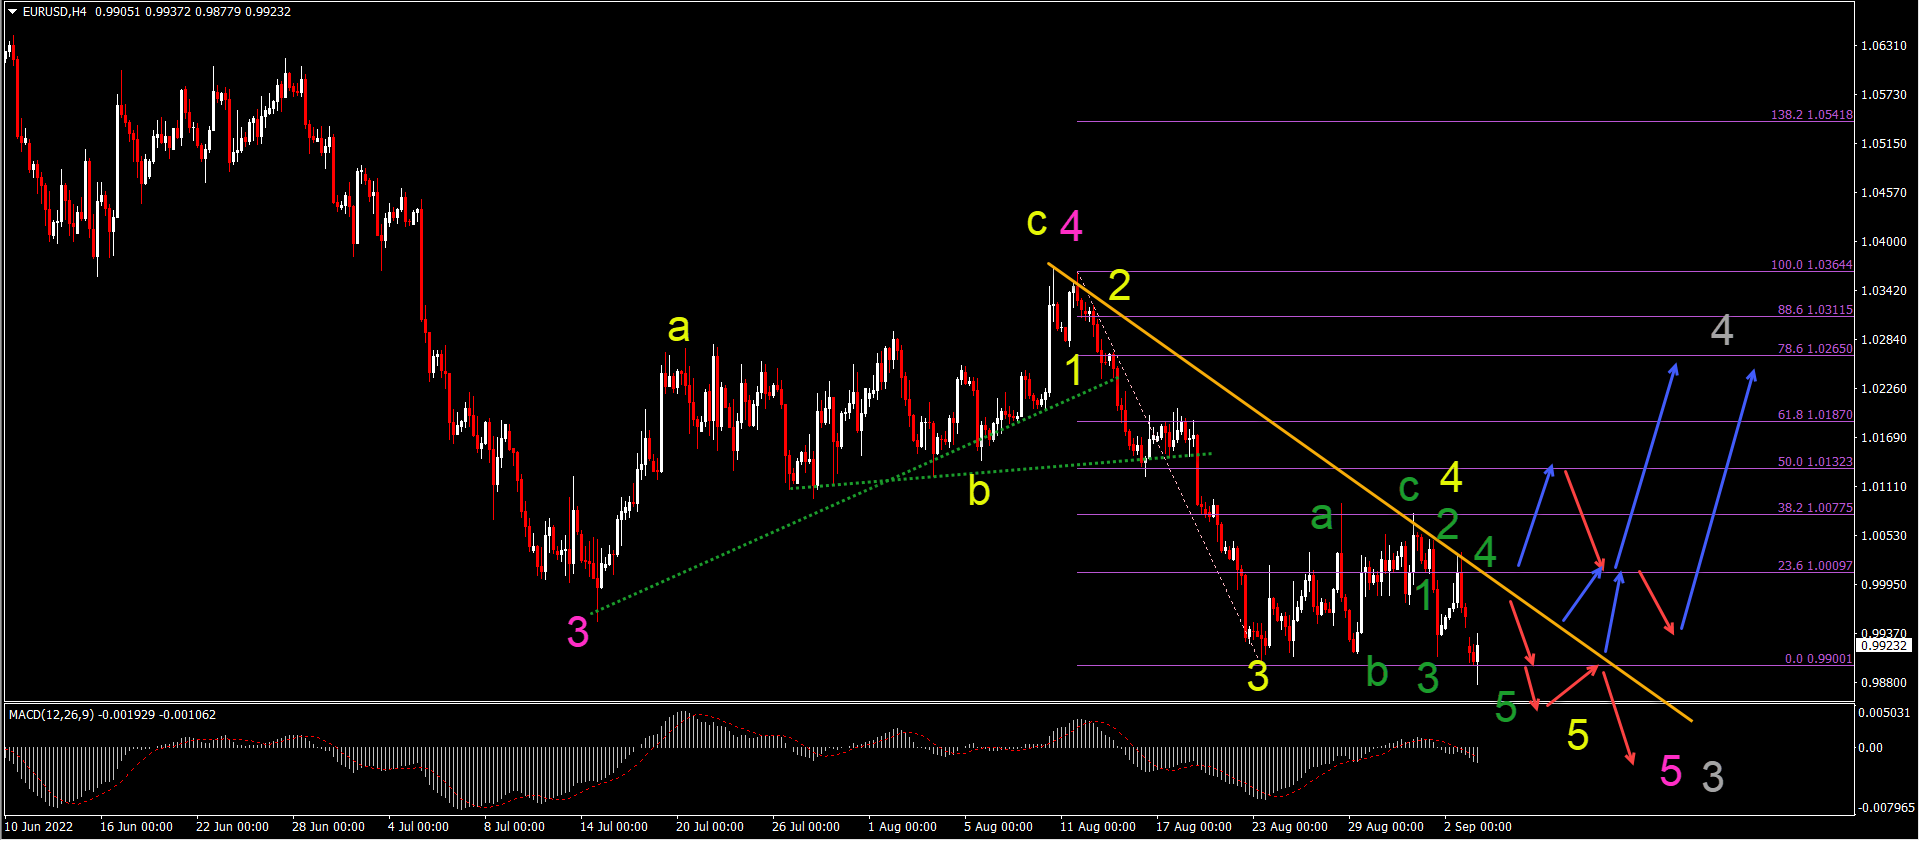
EUR/USD new low aims at 0.9750 target
The EUR/USD made a new low again after a shallow bullish correction:
-
The EUR/USD made a bearish bounce at the 38.2% Fibonacci retracement level.
-
The break below the previous bottom could either be part of a complex wave 4 (yellow) or part of the downtrend within wave 5 (yellow). We prefer the wave 5 scenario and expect price action to make a bearish bounce at the resistance trend line (orange) and/or break the bottom and a new lower low.
-
The main target zone is the support area around 0.9750-0.98.
-
A break above the resistance trend line (orange) would however change the perspective and indicate the end of the downtrend.
-
A stronger bullish retracement could emerge within wave 4 (gray) after price action completes wave 5 (yellow) of wave 5 (pink) of wave 3 (gray).
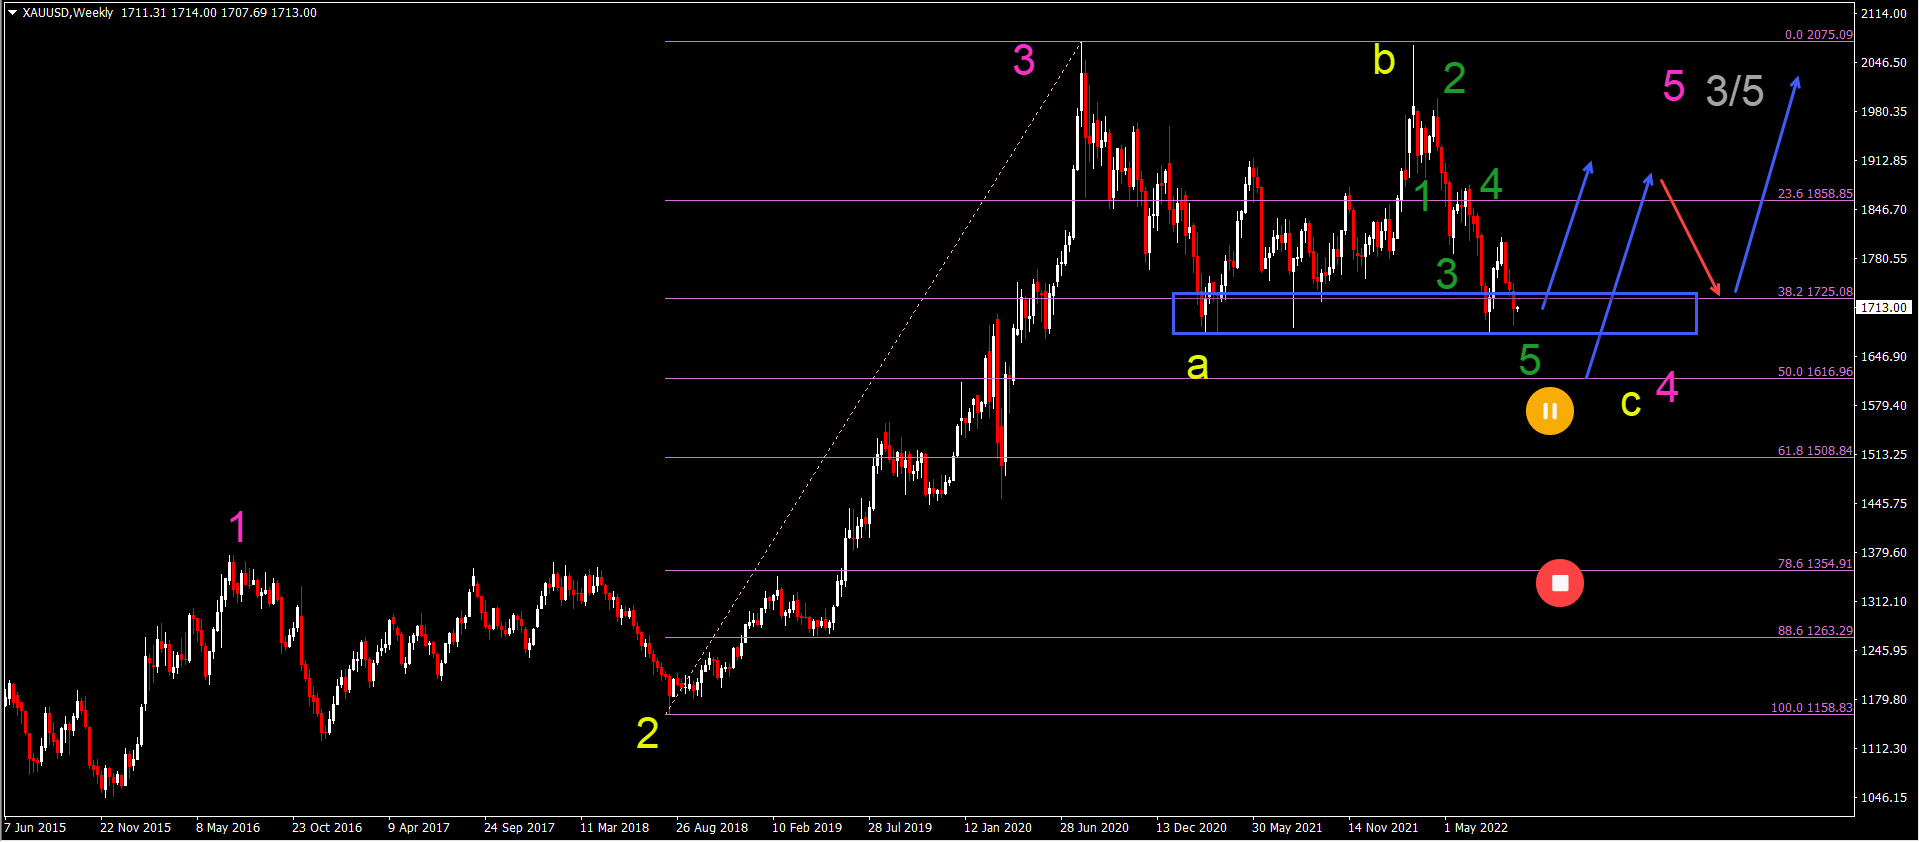
Gold testing key 38.2% Fibonacci support
Gold (XAU/USD) is testing the support zone (blue box) and Fibonacci retracement levels:
-
The XAU/USD seems to be completing a wave 5 (green) of a larger ABC (yellow) correction in wave 4 (pink).
-
The 38.2% and 50% Fibonacci support levels should remain unbroken if indeed this Elliott Wave analysis is correct and price action is within a wave 4 (pink).
-
A break below the 50% Fibonacci is a first warning that the current bullish Elliott Wave analysis is incorrect whereas a move towards the 78.6% Fib invalidates it.
-
A bullish recovery, however, could develop slowly with a momentum upwards (blue arrow) followed by a deep bearish retracement (red arrow).
-
Price action might only break for a new higher high in 2023. First price action will need to test the double top and then after a berish bounce, price action could push above it.
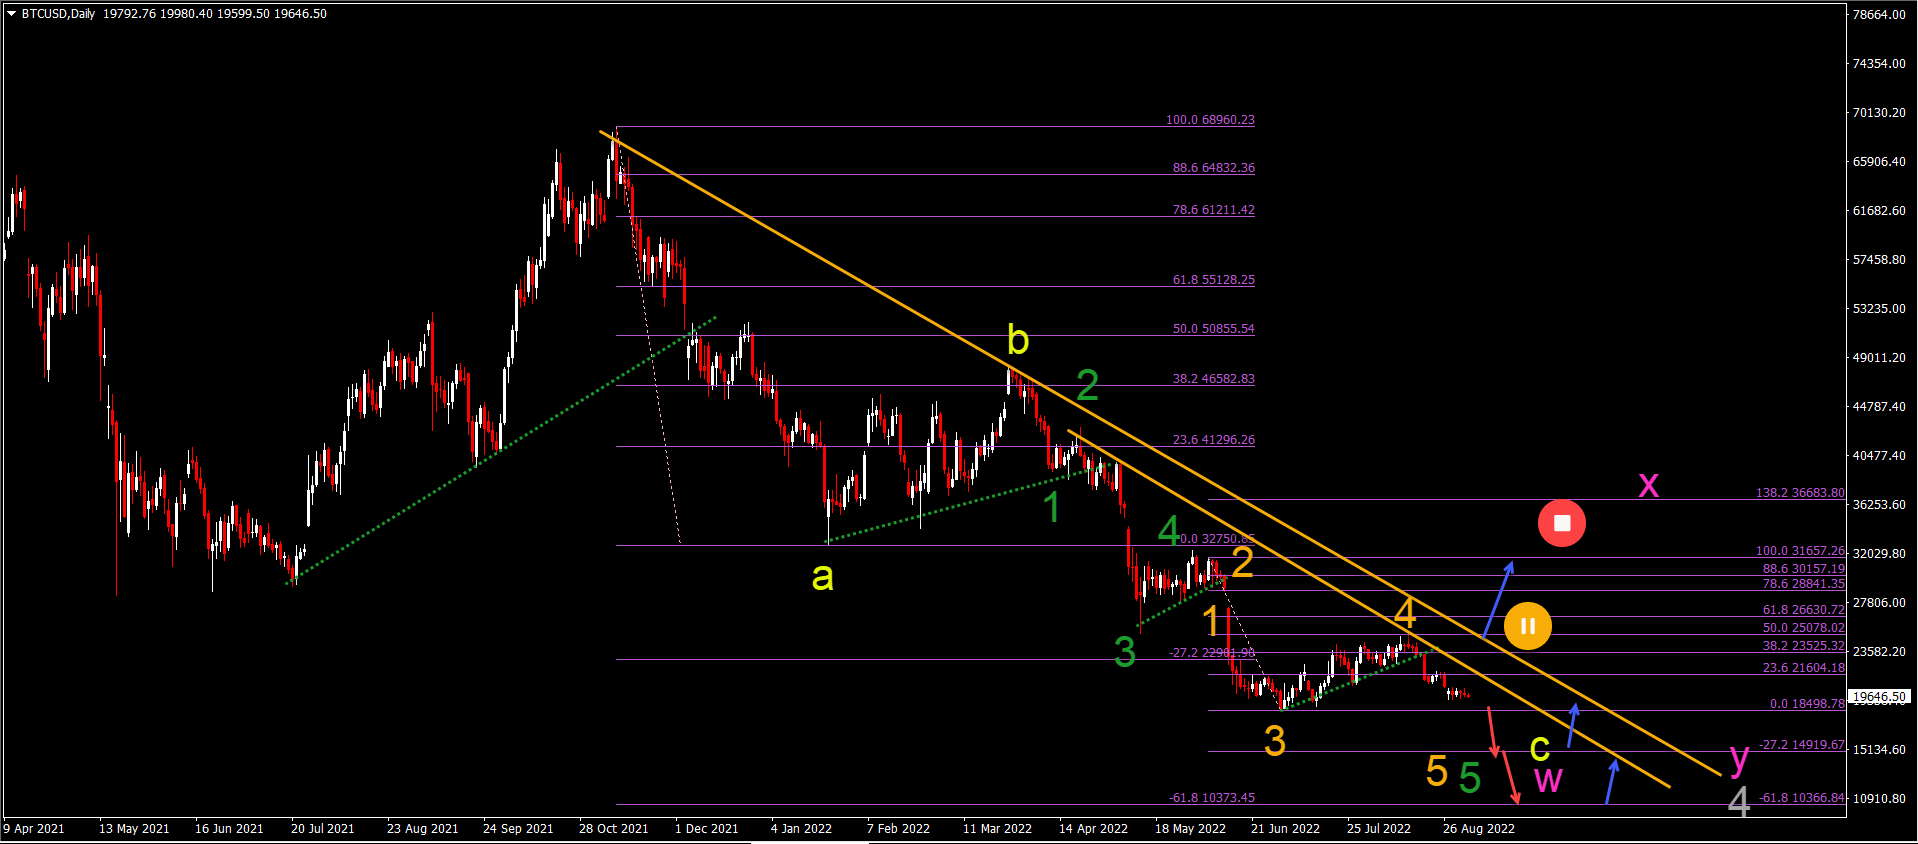
BTC/USD price action too bearish for any reversal
Bitcoin (BTC/USD) analysis from last week seems unlikely at the moment because of the bearish momentum and lengthy and shallow bullish price movement:
-
BTC/USD needs a break above (blue arrow) the resistance trend lines (orange) and 50% Fibonacci level before the bulls can be optimistic about any kind of rally.
-
Therefore, we decided to change the Elliott Wave analysis this week to provide a fresh and new perspective.
-
The bullish correction was probably a wave 4 (orange) within a downtrend, rather than a wave A (or a larger ABC up).
-
The current bearish swing is expected to be a wave 5 (orange).
-
A break below (red arrows) the previous low would confirm the wave 5 (orange).
-
The main bearish targets are $15k and $10k.
-
A bullish rebound (blue arrows) is expected at one of these targets.
The analysis has been done with the indicators and template from the SWAT method simple wave analysis and trading. For more daily technical and wave analysis and updates, sign-up to our newsletter
Author

Chris Svorcik
FS method
Chris Svorcik is a trader, analyst, and educator with over 15 years of experience in financial markets, specializing in moving averages, market structure, and price patterns.


