Weekly Waves: EURUSD, Bitcoin and Gold
- The EUR/USD is showing a bearish pinbar on the weekly chart, which is a major bearish reversal candlestick pattern
- Bitcoin (BTC/USD) has respected most of the Fibonacci retracement levels. Recently price action has broken below the 78.6% Fibonacci
- US30 made a strong bullish bounce at the 61.8% Fibonacci support. The US30 bullish bounce has now reached a strong resistance zone

Our weekly Elliott Wave analysis reviews the EUR/USD weekly chart, the US30 weekly chart, and the Bitcoin weekly chart.
EURUSD Bearish Pinbar Candlestick Pattern
The EUR/USD is showing a bearish pinbar on the weekly chart, which is a major bearish reversal candlestick pattern:
- The EUR/USD bearish pinbar is indicating that the bulls are running out of steam. A reversal is now expected after price action has hit the -100% Fibonacci target.
- The bullish price swing could have completed an ABC (yellow) correction.
- The ABC (yellow) is probably part of a larger and more complex WXY (pink) correction.
- A breakout below the weekly candle low should price action lower (red arrow).
- A bearish decline could confirm an ABC (yellow) within the wave X (pink).

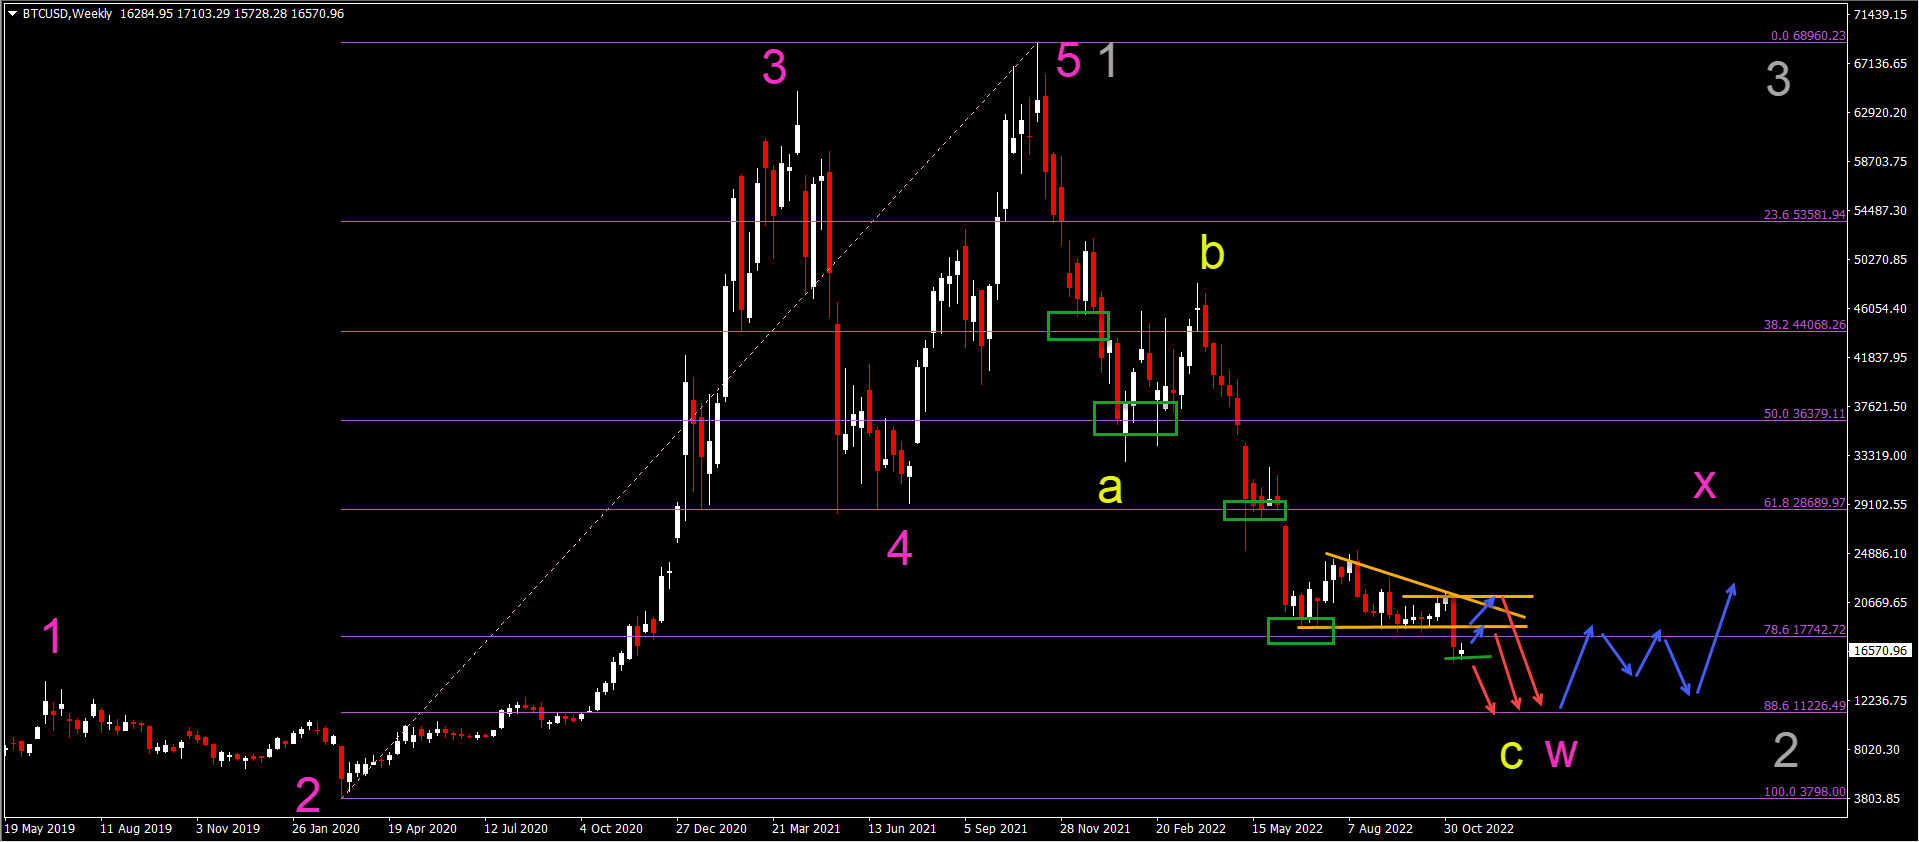
Bitcoin Bearish Breakout Below 78.6% Fib
Bitcoin (BTC/USD) has respected most of the Fibonacci retracement levels. Recently price action has broken below the 78.6% Fibonacci:
- The BTC/USD break below the 78.6% Fibonacci retracement level indicates a likely further decline towards the 88.6% Fibonacci level.
- The bearish breakout could either see an immediate continuation (red arrow) if it breaks below the weekly candle low (green line).
- Or price action could make a bullish retracement first towards the resistance zone (orange lines) before making another bearish swing (red arrows).
- A bullish bounce (blue arrows) is expected at the 88.6% Fibonacci support level.
- Price action could either be completing a wave C (yellow) within wave 2 (gray) or a wave W (pink) of a larger WXY (pink) in wave 2 (gray).
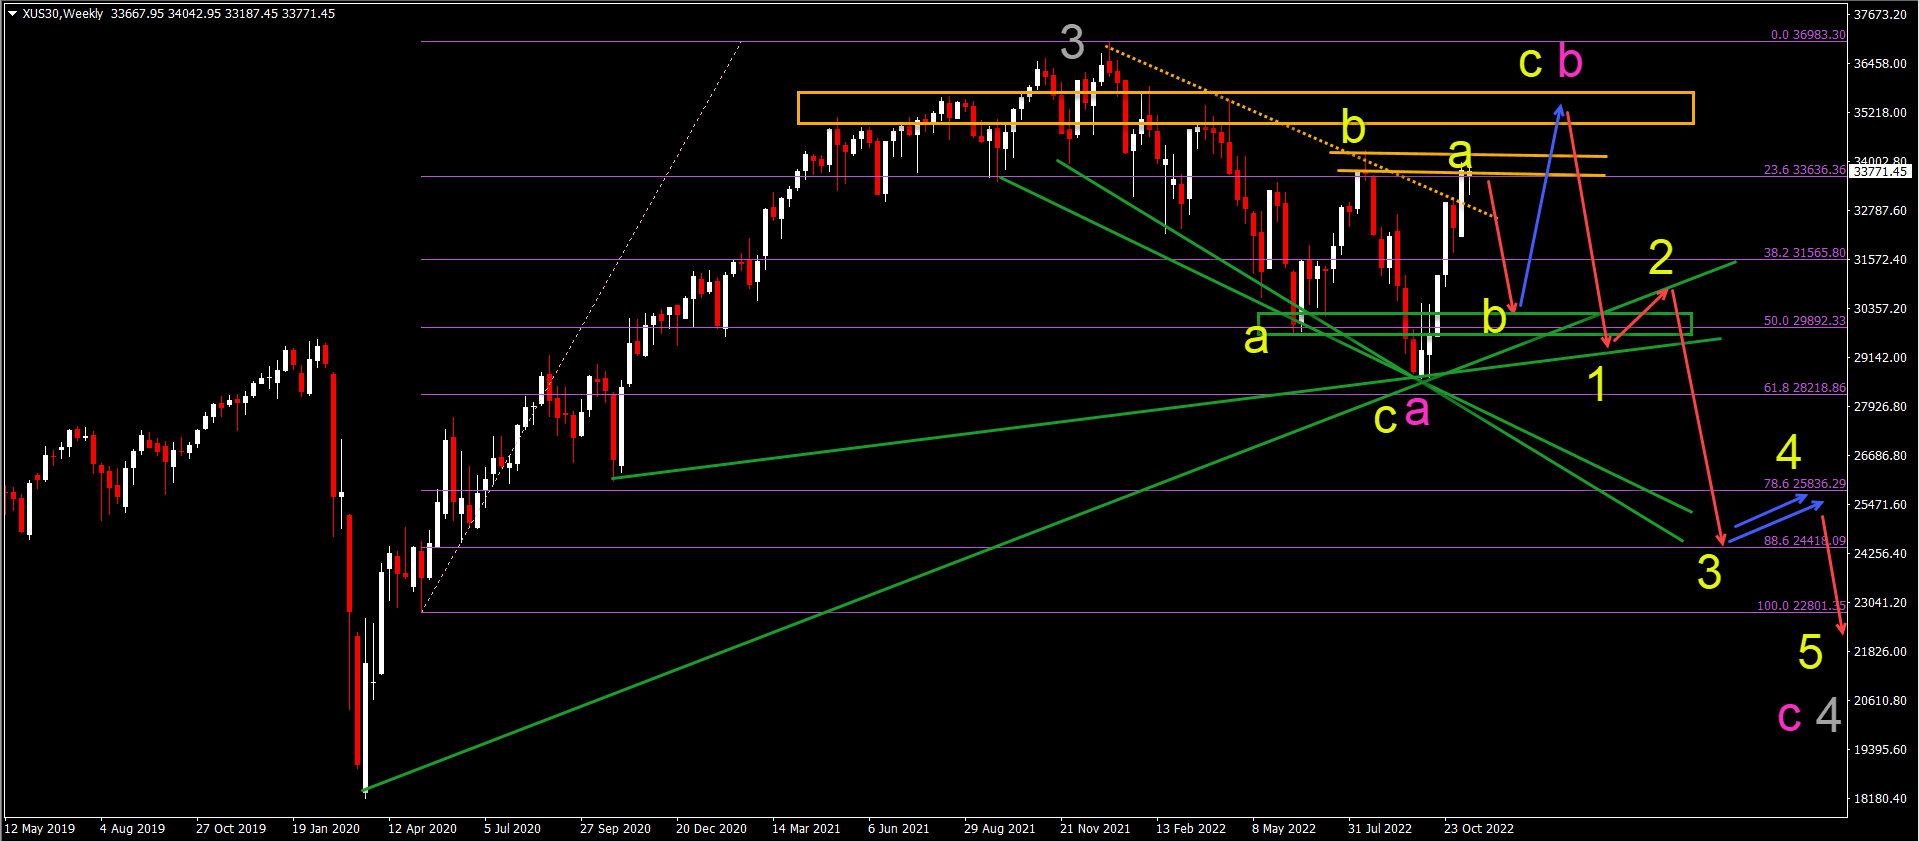
US30 Bullish Revival Faces Massive Resistance
US30 made a strong bullish bounce at the 61.8% Fibonacci support:
- The US30 bullish bounce has now reached a strong resistance zone (orange lines).
- A bearish bounce at the resistance is expected (red arrow) to test the support and inverted head and shoulders level (green box).
- A bullish bounce there could confirm a bullish ABC (yellow) within the wave B (pink).
- A larger bearish reversal (red arrows) is expected at the resistance zone (orange box).
- A bearish 5 wave pattern (yellow) could emerge and take price action below the support trend line (green).
Author

Chris Svorcik
FS method
Chris Svorcik is a trader, analyst, and educator with over 15 years of experience in financial markets, specializing in moving averages, market structure, and price patterns.
More from Chris Svorcik


