Weekly waves: EUR/USD, USD/JPY and Bitcoin
-
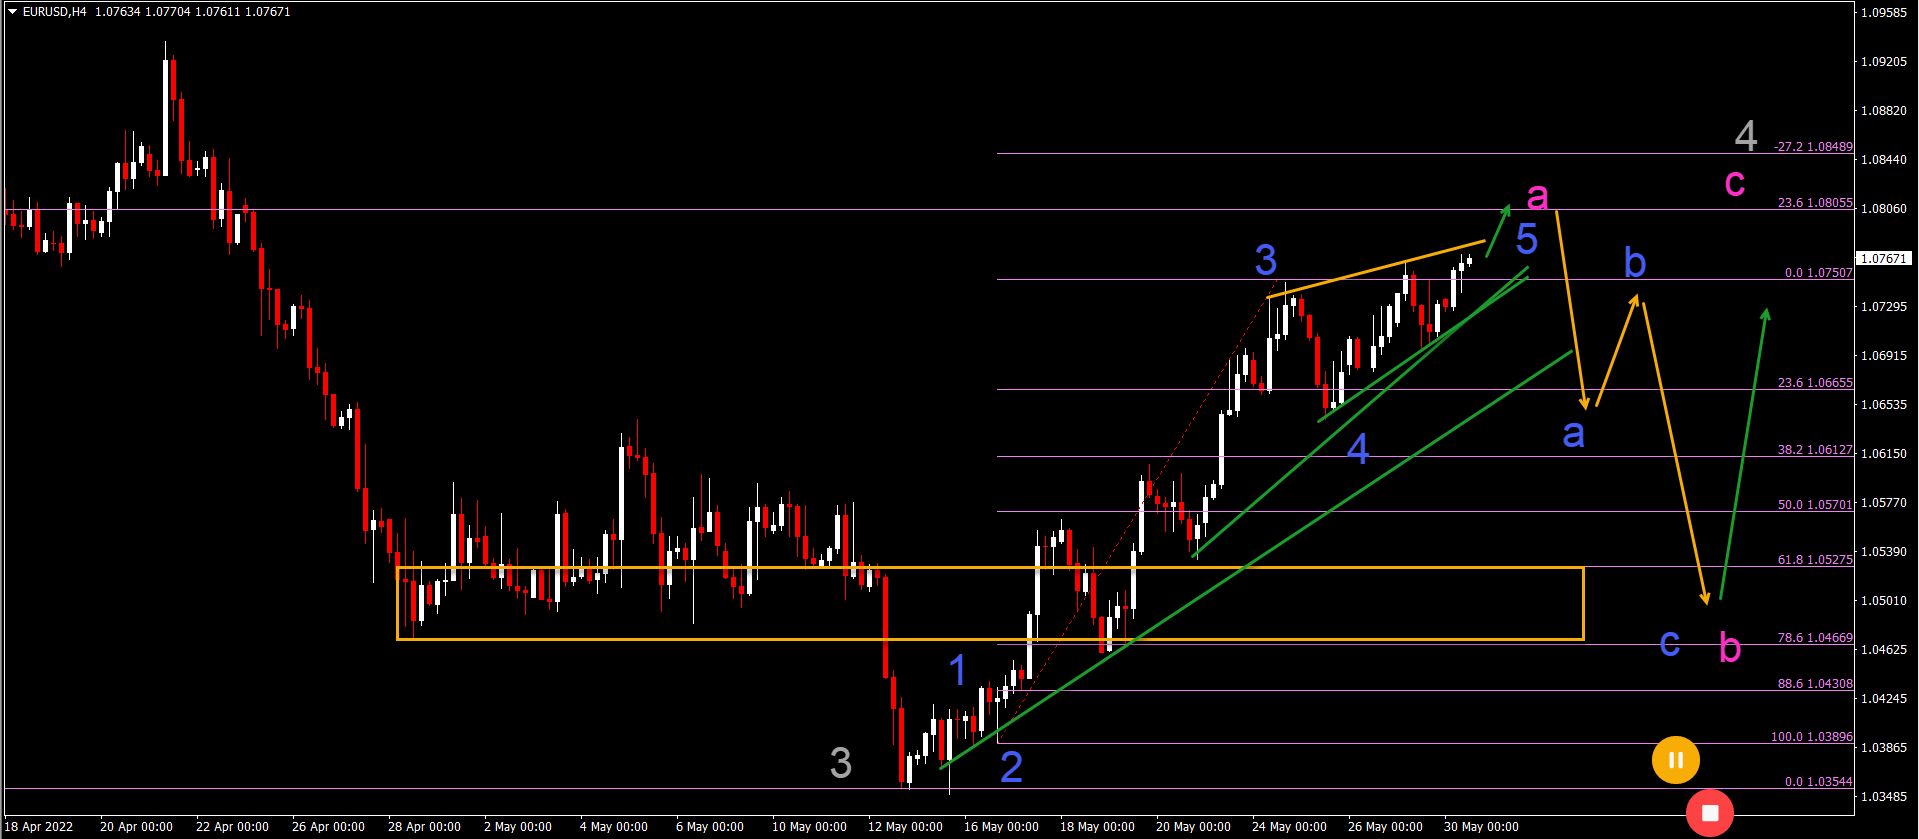
The EUR/USD completed a wave 3 (gray) of a larger downtrend. Now price action is preparing for a larger bullish correction.
-
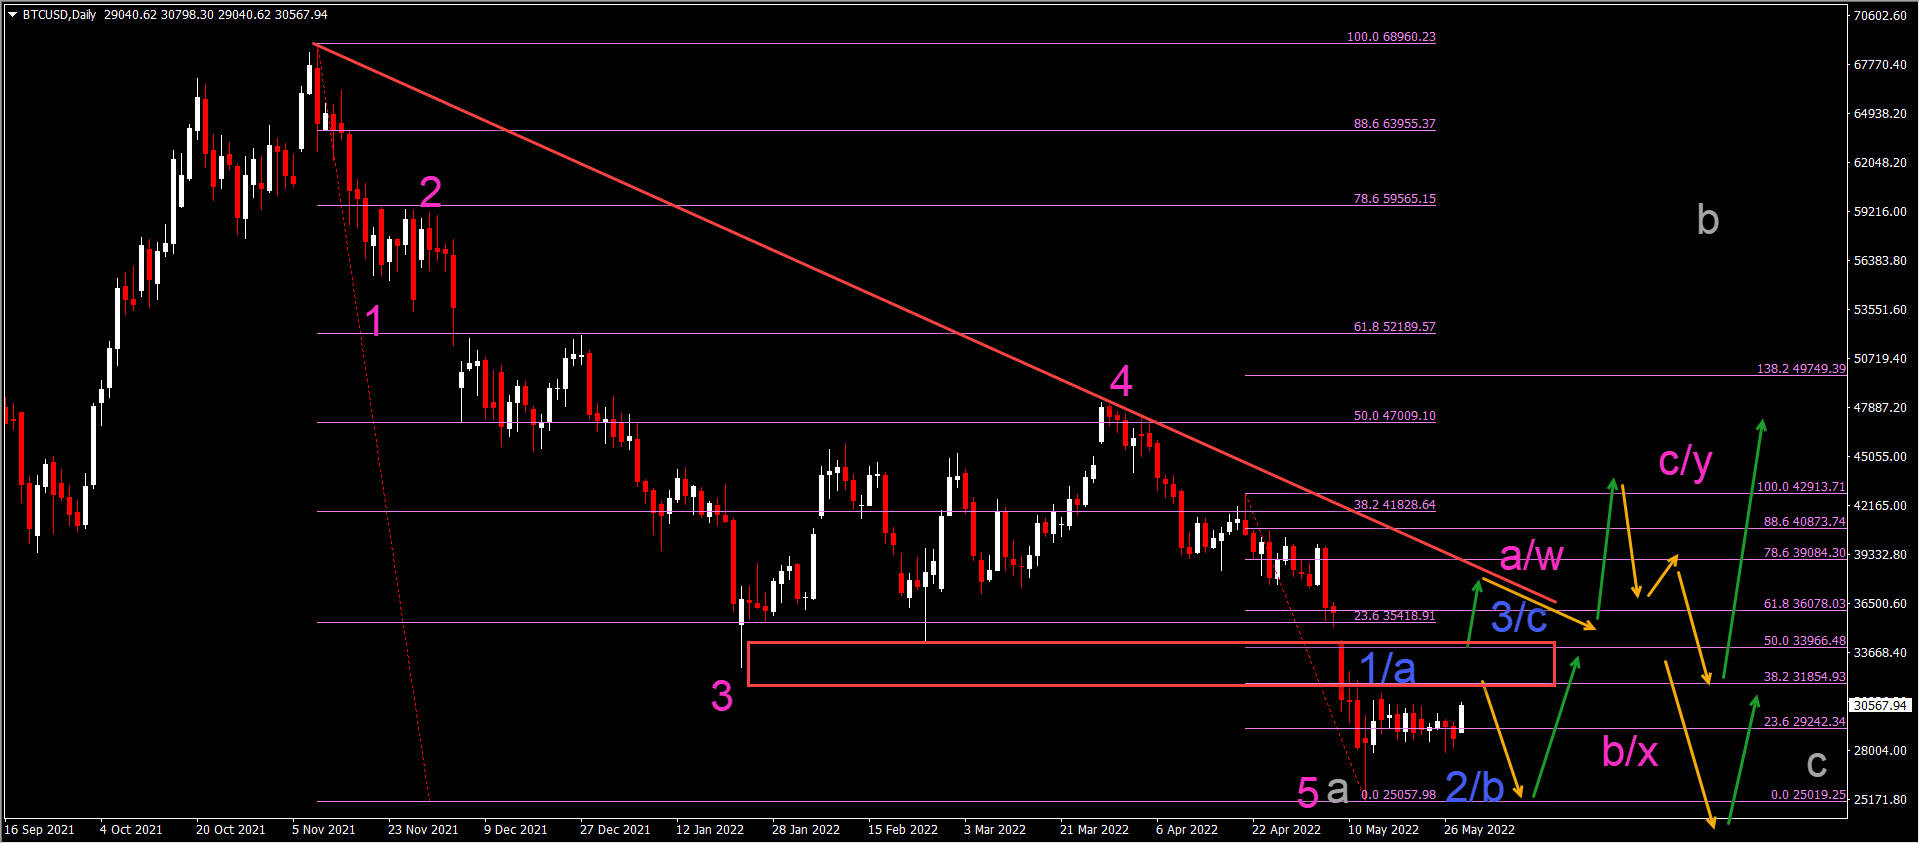
Bitcoin (BTC/USD) failed to break the support and lows for several days. Price action seems to be moving north now.
-
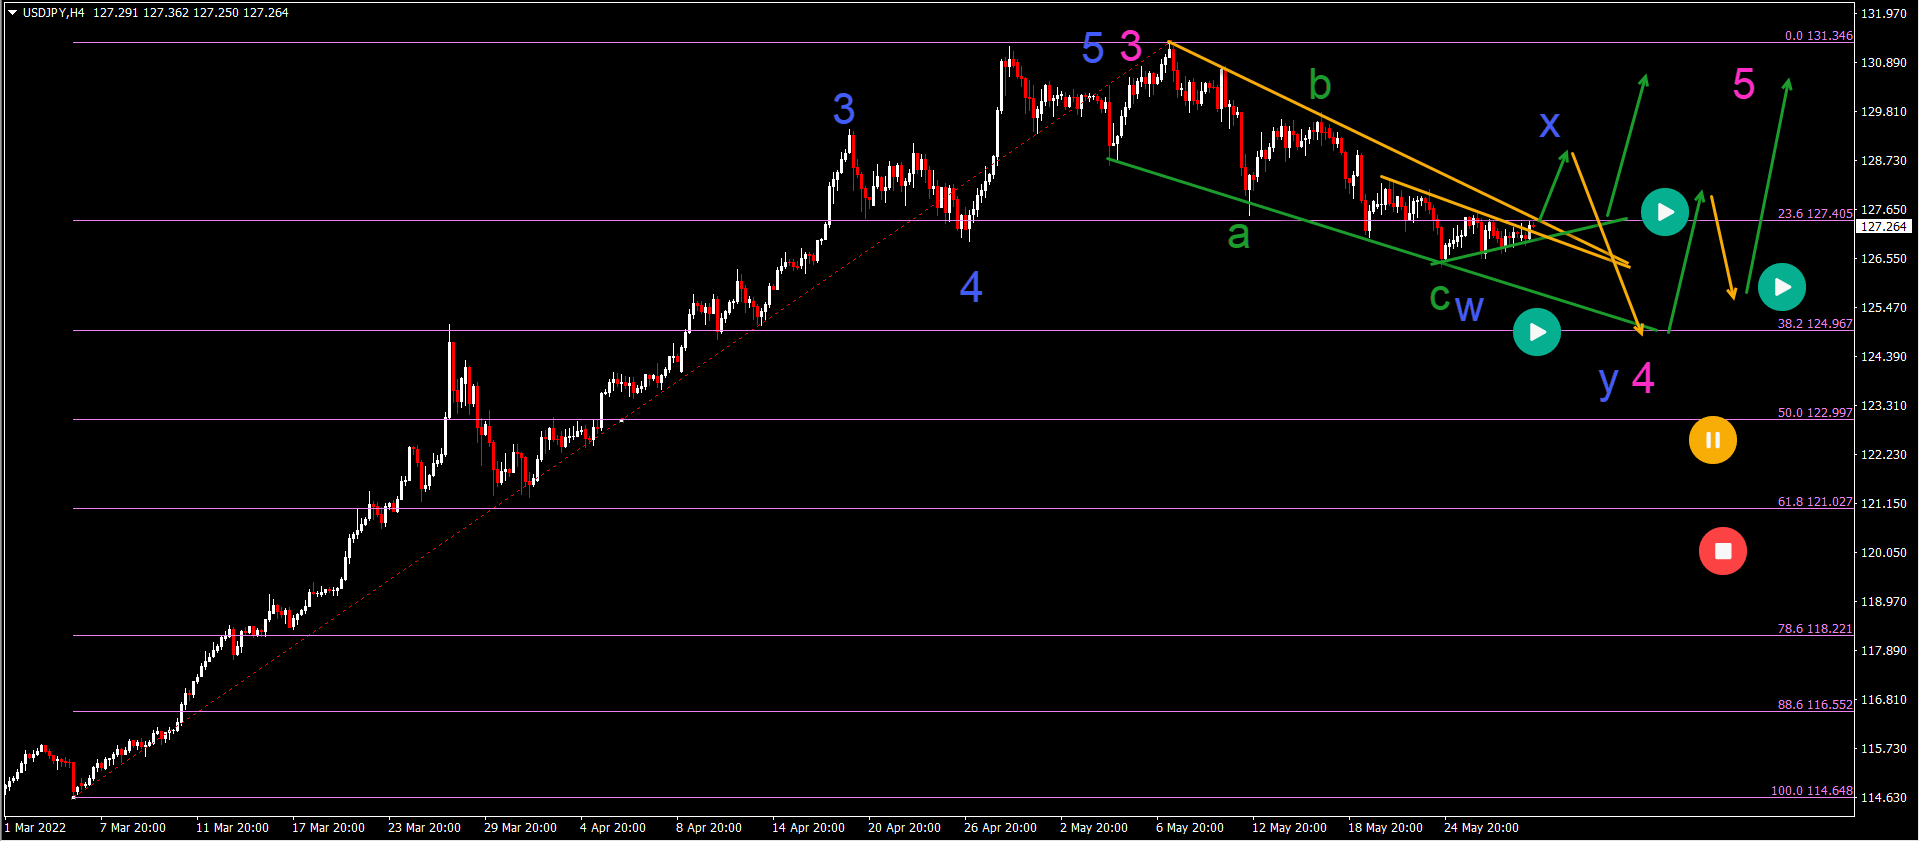
The bearish correction is choppy and shallow, as usual for a wave 4 (pink). The wave 4 (pink) remains valid as long as price action does not correct below the 50% Fib.

EUR/USD bullish ABC zigzag pattern
The EUR/USD completed a wave 3 (gray) of a larger downtrend. Now price action is preparing for a larger bullish correction:
-
The EUR/USD bullish price swing is unfolding in a 5 wave pattern (blue).
-
The current wave is probably a wave 5 (blue) of a larger wave A (pink).
-
The first target is the larger 23.6% Fibonacci retracement level of the wave 4 (gray).
-
A bearish bounce (orange arrows) could take place at the resistance level.
-
A bearish correction should create an ABC (blue) pattern in wave B (pink).
-
The bearish swing should not break the bottom otherwise the ABC (pink) zigzag becomes invalidated.
-
A bullish wave C (pink) could complete wave 4 (gray) or a wave W of 4.
BTC/USD finding support and a bullish bounce
Bitcoin (BTC/USD) failed to break the support and lows for several days. Price action seems to be moving north now:
-
The BTC/USD was in a strong downtrend.
-
The main question is: has the downtrend completed a wave 5 (pink) of wave a (gray) or will there be one more low remaining?
-
The resistance levels are the critical resistance zone for that decision.
-
A bullish breakout (green arrow) could confirm a larger 123 (blue) pattern within an ABC (pink).
-
A bearish bounce (orange arrow) could indicate an ABC (blue) pattern within a WXY (pink).
-
Eventually price action is expected to complete an ABC (gray) pattern.
USD/JPY
The USD/JPY is building a bearish correction in a solid uptrend:
-
The uptrend seems to have completed a wave 3 (pink) pattern.
-
The bearish correction is choppy and shallow, as usual for a wave 4 (pink).
-
The wave 4 (pink) remains valid as long as price action does not correct below the 50% Fib or deeper.
-
A complex correction via a WXY (blue) pattern could unfold in wave 4 (pink).
-
A bullish bounce is expected at the 38.2% Fibonacci level if price action manages to reach it.
-
Price action needs a clear higher low plus bounce before the wave 4 (pink) could be considered completed.
The analysis has been done with the indicators and template from the SWAT method simple wave analysis and trading. For more daily technical and wave analysis and updates, sign-up to our newsletter
Author

Chris Svorcik
FS method
Chris Svorcik is a trader, analyst, and educator with over 15 years of experience in financial markets, specializing in moving averages, market structure, and price patterns.
















