Weekly waves: EUR/USD, US30 and Bitcoin
-
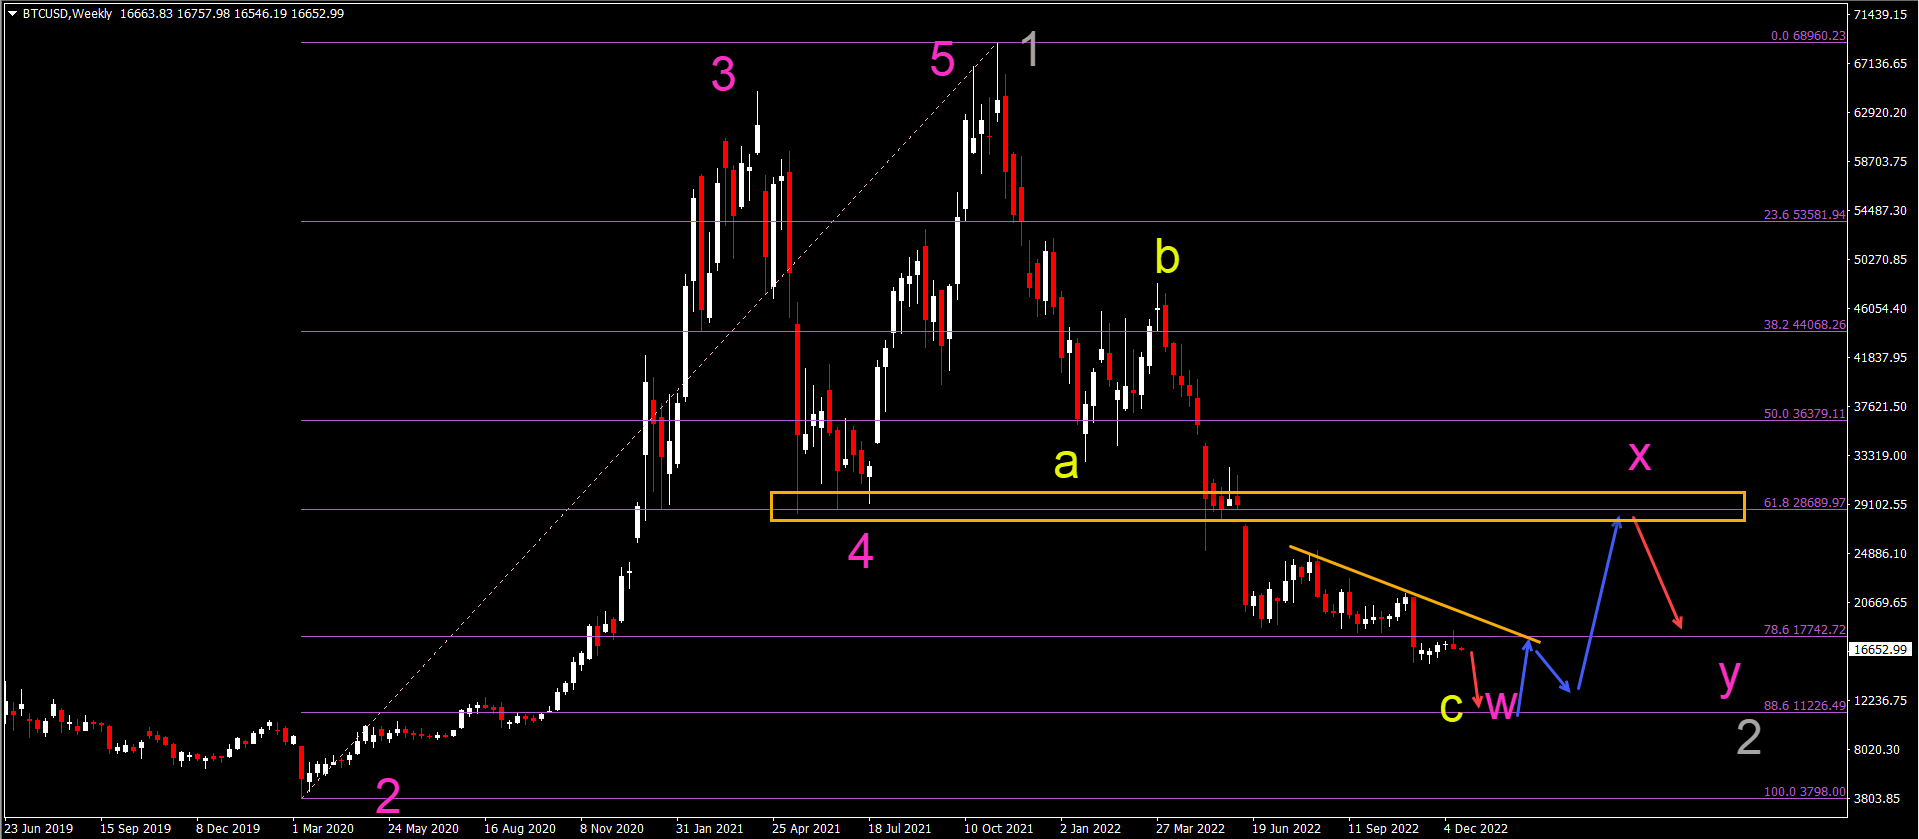
Bitcoin (BTC/USD) broke below the 78.6% Fibonacci retracement level and has been unable to break above that level ever since.
-
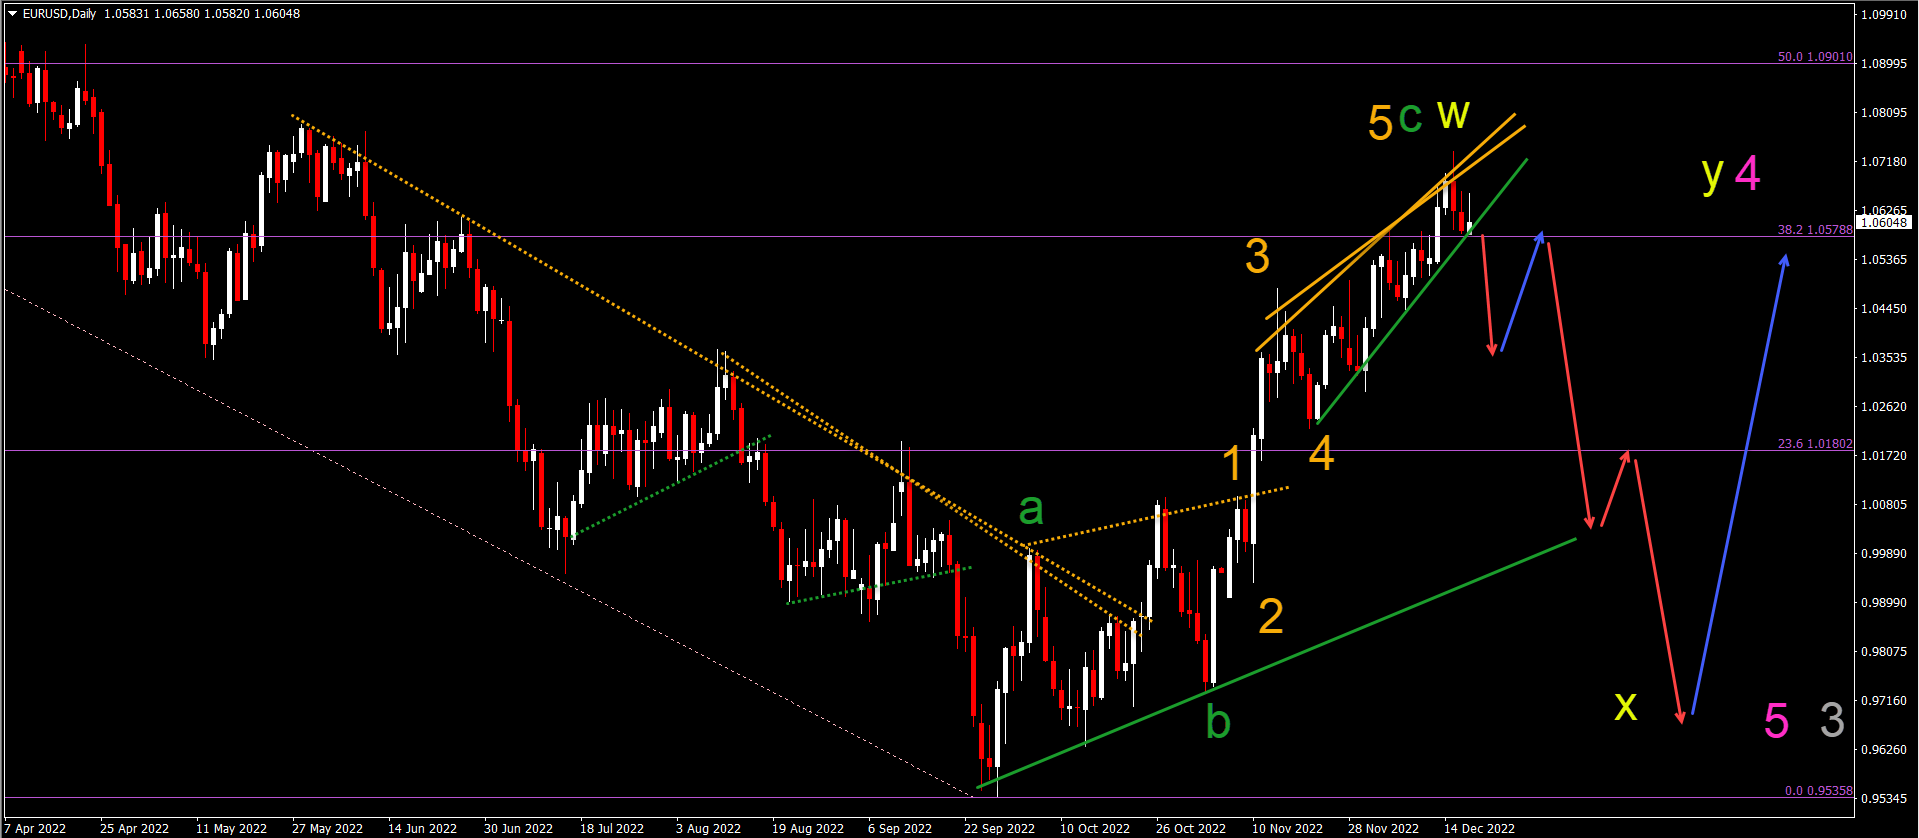
The EUR/USD is building a rising wedge chart pattern, which could indicate a bearish reversal soon.
-
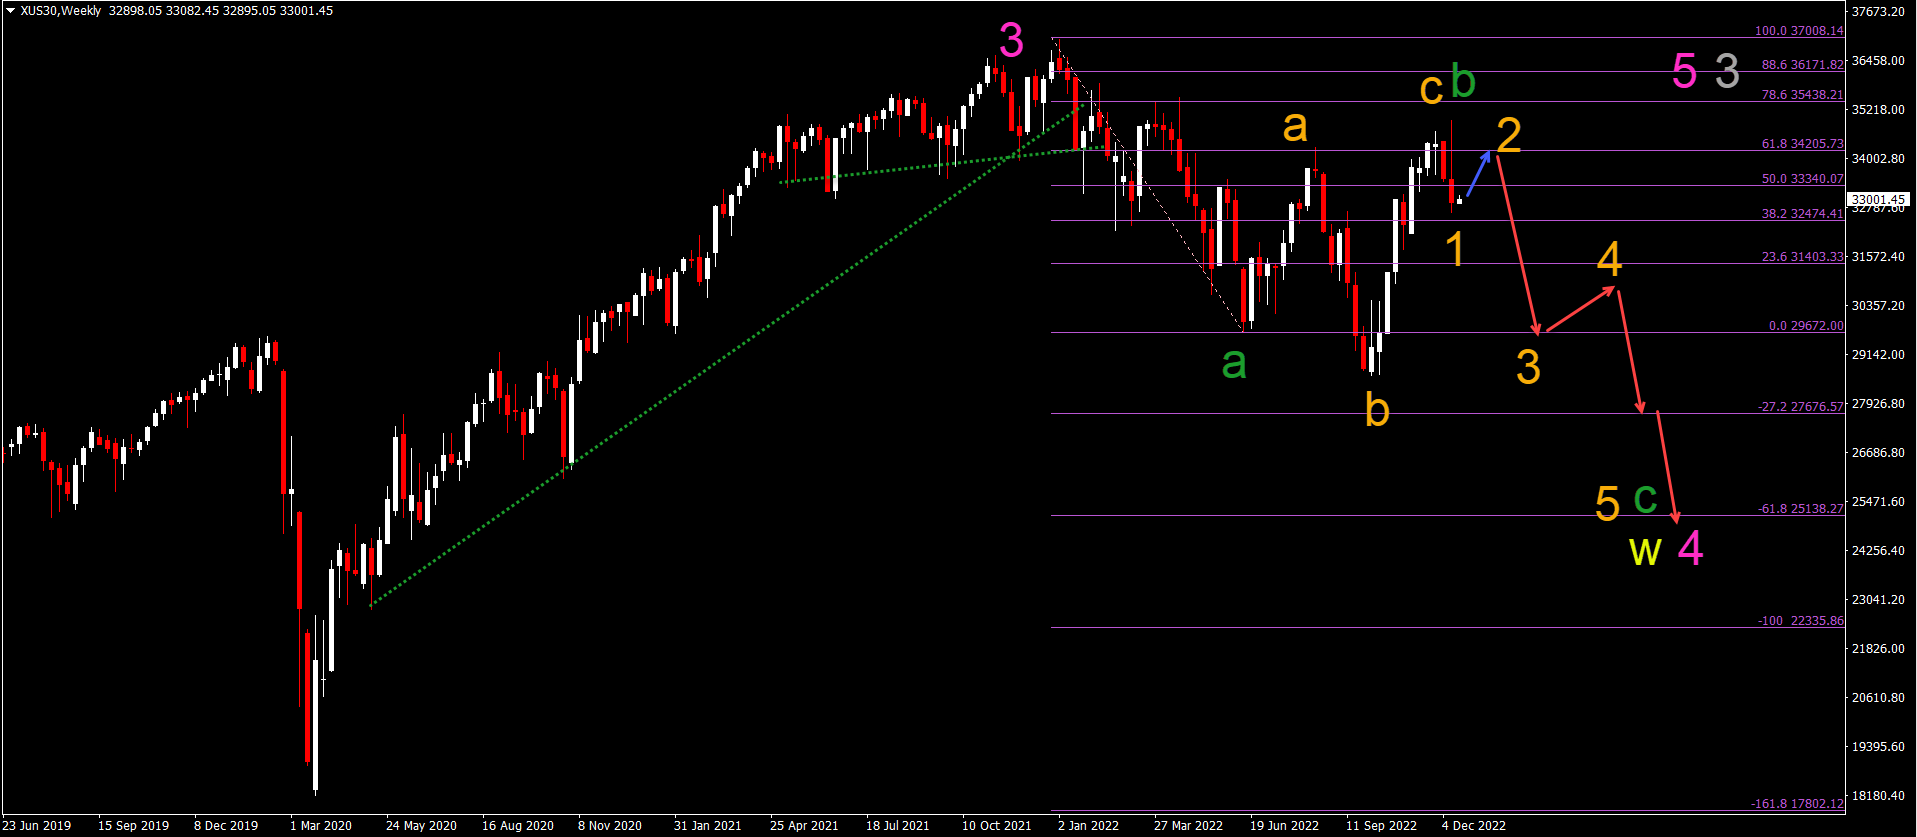
The US30 chart made a strong bullish rally after breaking below the $30k support level. Let’s review the next expected price swings.

Our weekly Elliott Wave analysis reviews the EUR/USD daily chart, the US30 weekly chart, and the Bitcoin weekly chart.
EUR/USD bearish candlestick pattern completes bull run
-
The EUR/USD is building a 5th bullish wave (orange).
-
This 5th wave (orange) seems to be completed due to the strong bearish candlestick pattern last week.
-
Price action is now testing the support trend line (green) of the rising wedge pattern.
-
A breakout (red arrow) below the support line would confirm the end of the wave 5 (orange) of wave C (green) and wave W (yellow).
-
A larger WXY (yellow) could develop within a wave 4 (pink) pattern.
US30 bearish reversal aims at $25k support
-
The US30 has reached a key resistance zone due to the deep Fibonacci levels.
-
The US30 showed strong bearish candlestick patterns at the resistance zone, which indicates a potential bearish reversal.
-
The bullish swing is expected to be a wave C (orange) of a larger ABC (orange) correction in wave B (green).
-
Now that the ABC (orange) of wave B (green) is completed, price action should start a downtrend within an impulsive wave C (green) of a larger ABC (green).
-
The main bearish target is the -27.2% Fibonacci target at $27,676. The -61.8% Fibonacci target is located around the $25k support.
Bitcoin rejection weekly candle
-
The indecisive price action followed by last week’s bearish rejection candlestick pattern leaves the door open for a downtrend continuation.
-
The next bearish price swing (red arrow) is aiming at the 88.6% Fibonacci around $11.2k.
-
Price action could bounce back up (blue arrow) at this support Fibonacci level.
-
A bullish bounce could mark the end of the bearish ABC (yellow) pattern within wave W (pink).
-
A bullish bounce could be within a wave X (pink) of a larger WXY (pink) in wave 2 (gray).
The analysis has been done with the indicators and template from the SWAT method simple wave analysis and trading. For more daily technical and wave analysis and updates, sign-up to our newsletter
Author

Chris Svorcik
Elite CurrenSea
Experience Chris Svorcik has co-founded Elite CurrenSea in 2014 together with Nenad Kerkez, aka Tarantula FX. Chris is a technical analyst, wave analyst, trader, writer, educator, webinar speaker, and seminar speaker of the financial markets.


