Weekly waves: EUR/USD, GBP/USD and Bitcoin
-
Our weekly Elliott Wave analysis reviews the EUR/USD daily chart, the GBP/USD weekly chart, and the Bitcoin crypto currency daily chart.
-
The EUR/USD made a new low but price action was finally weaker, which is a first indication that a larger bullish retracement could take place.
-
Bitcoin (BTC/USD) is testing the previous bottom and the main question will be whether price action will bounce or break.

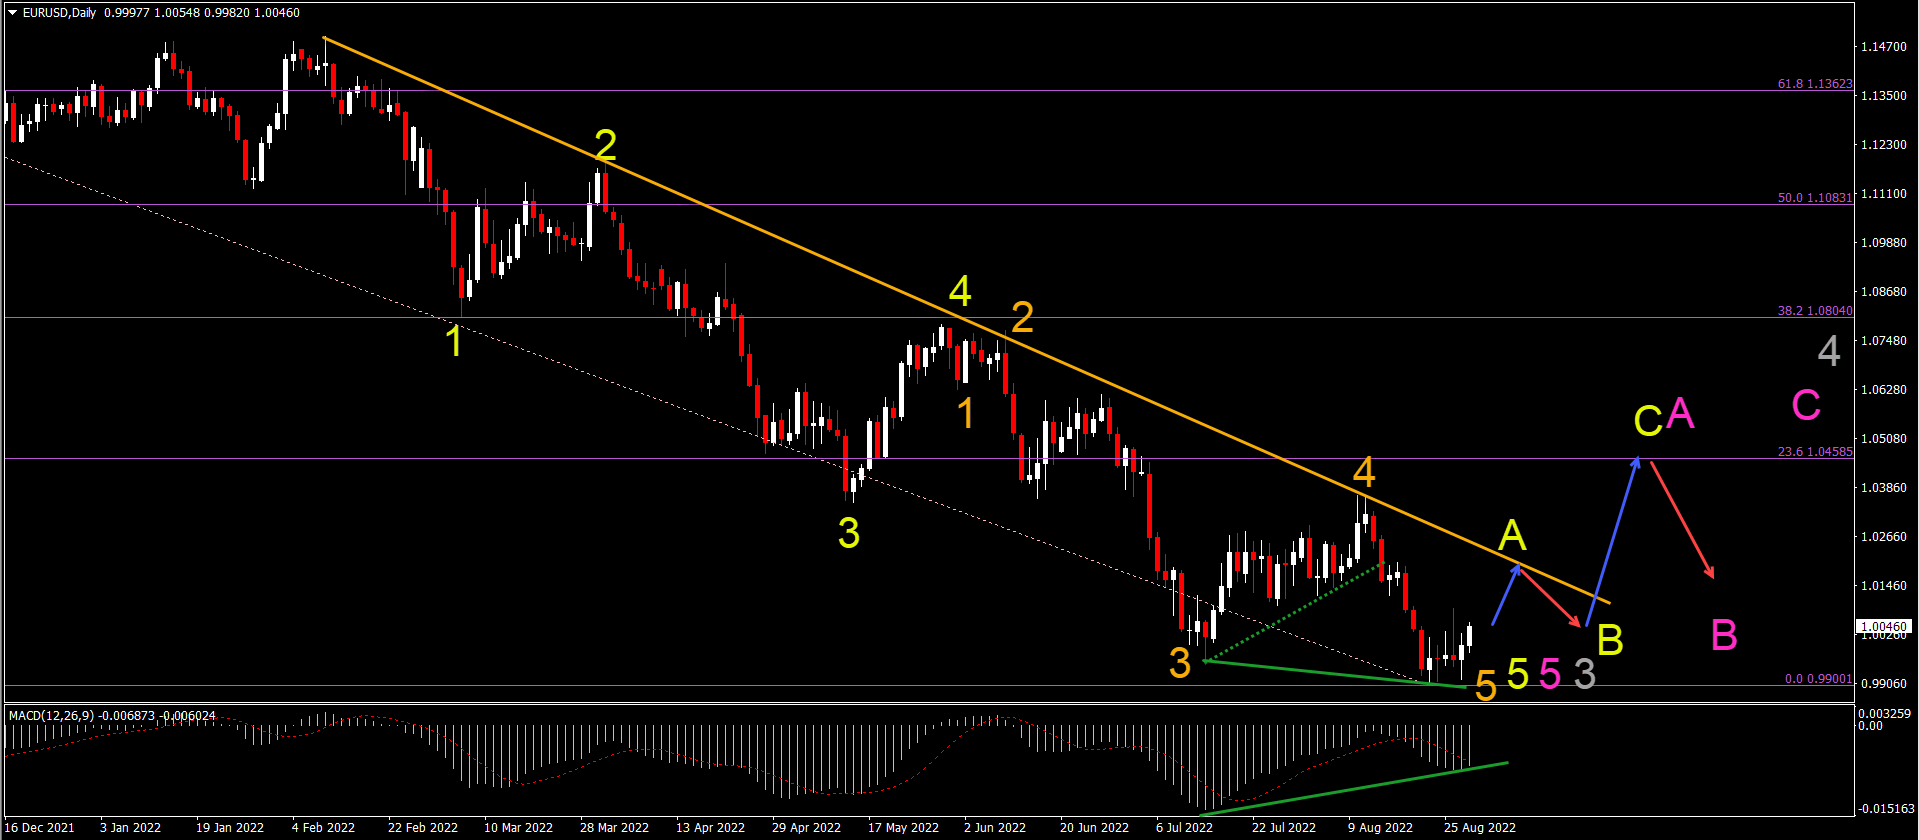
EUR/USD retracement towards 1.05 and 1.08
-
The EUR/USD bullish divergence has appeared between the two recent daily bottoms (green lines on price chart and MACD).
-
The divergence pattern indicates a potential bullish reversal or retracement.
-
Because price action is probably in wave 3 (gray), we expect a shallow and choppy correction within wave 4 (gray) and not a larger reversal.
-
An ABC (yellow) pattern could unfold within a larger wave A (pink) of wave 4 (gray).
-
The bullish targets are the 23.6% Fibonacci retracement level near 1.0450 and 38.2% Fib near 1.08 of the wave 4 (gray).
-
The downtrend within wave 5 (gray) could aim at 0.9750, 0.95, and 0.925.
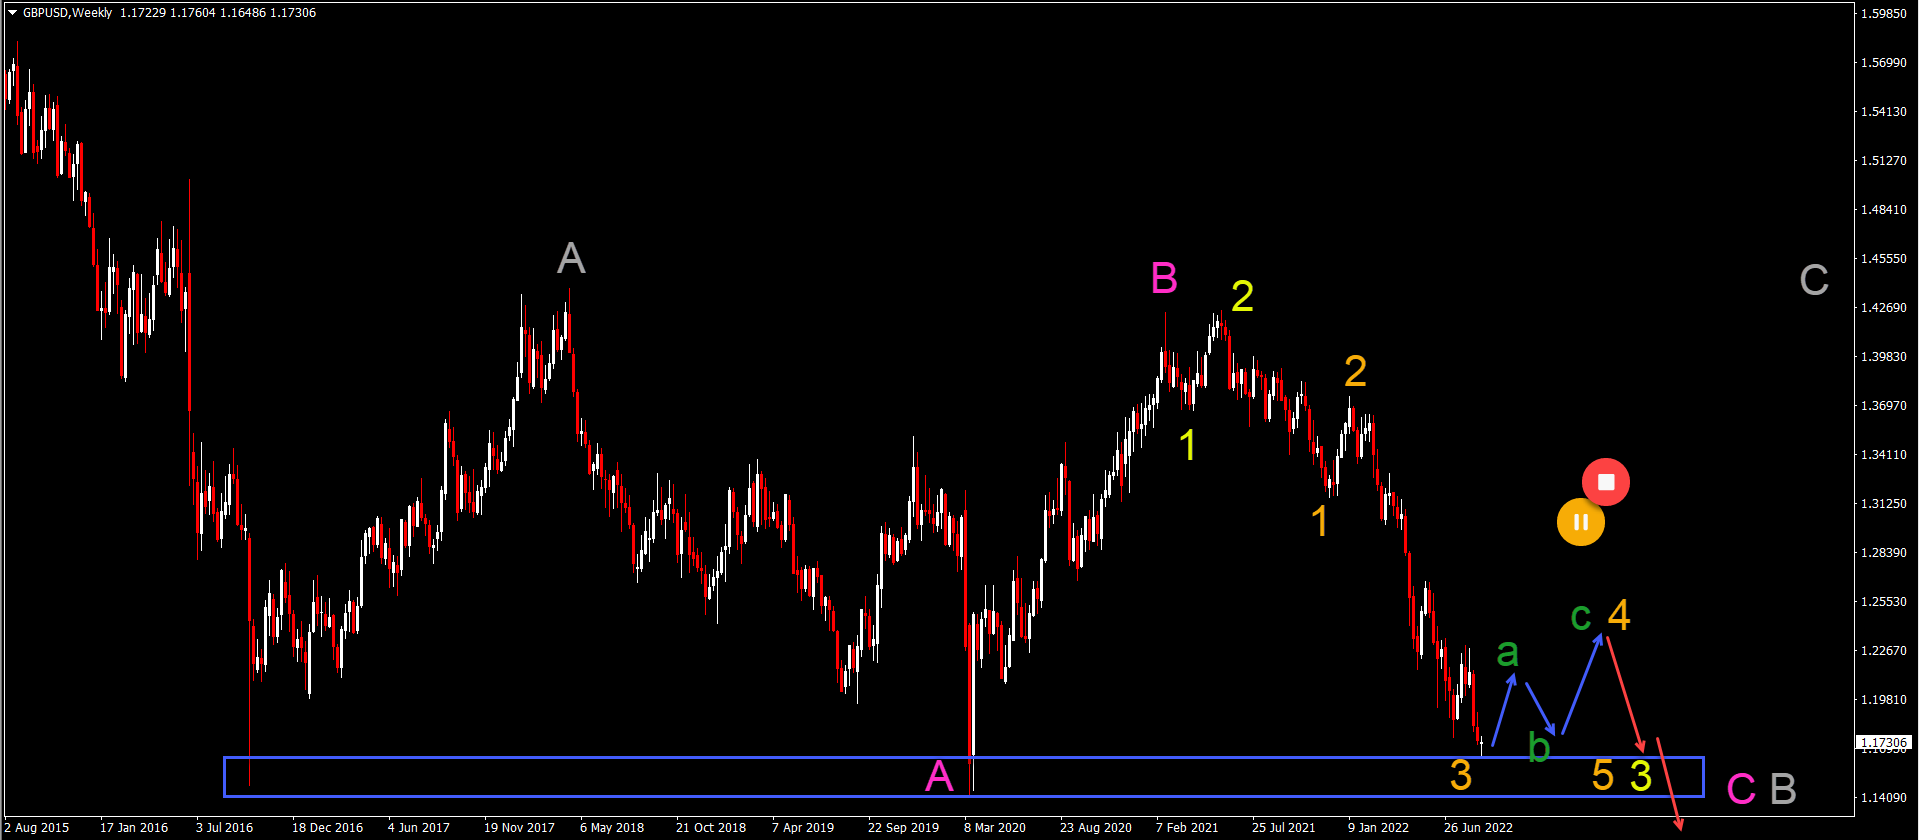
GBP/USD bullish Pullback to 1.2250
The GBP/USD is showing a massive bearish impulse but a strong support zone (blue) is now in its way:
-
The GBP/USD is expected to build a bullish retracement, just like the EUR/USD.
-
Considering the strong bearish momentum, we estimate that price action is probably in a wave 3 (orange).
-
This remains valid as long as the bullish retracement is not very impulsive and does not break above 1.25 and especially above 1.28 and 1.30.
-
A bullish ABC (green) is expected to complete the wave 4 (orange) around 1.2250.
-
The downtrend within wave 5 (orange) of wave 3 (yellow) could take price to 1.15 and perhaps 1.14 and 1.1250.
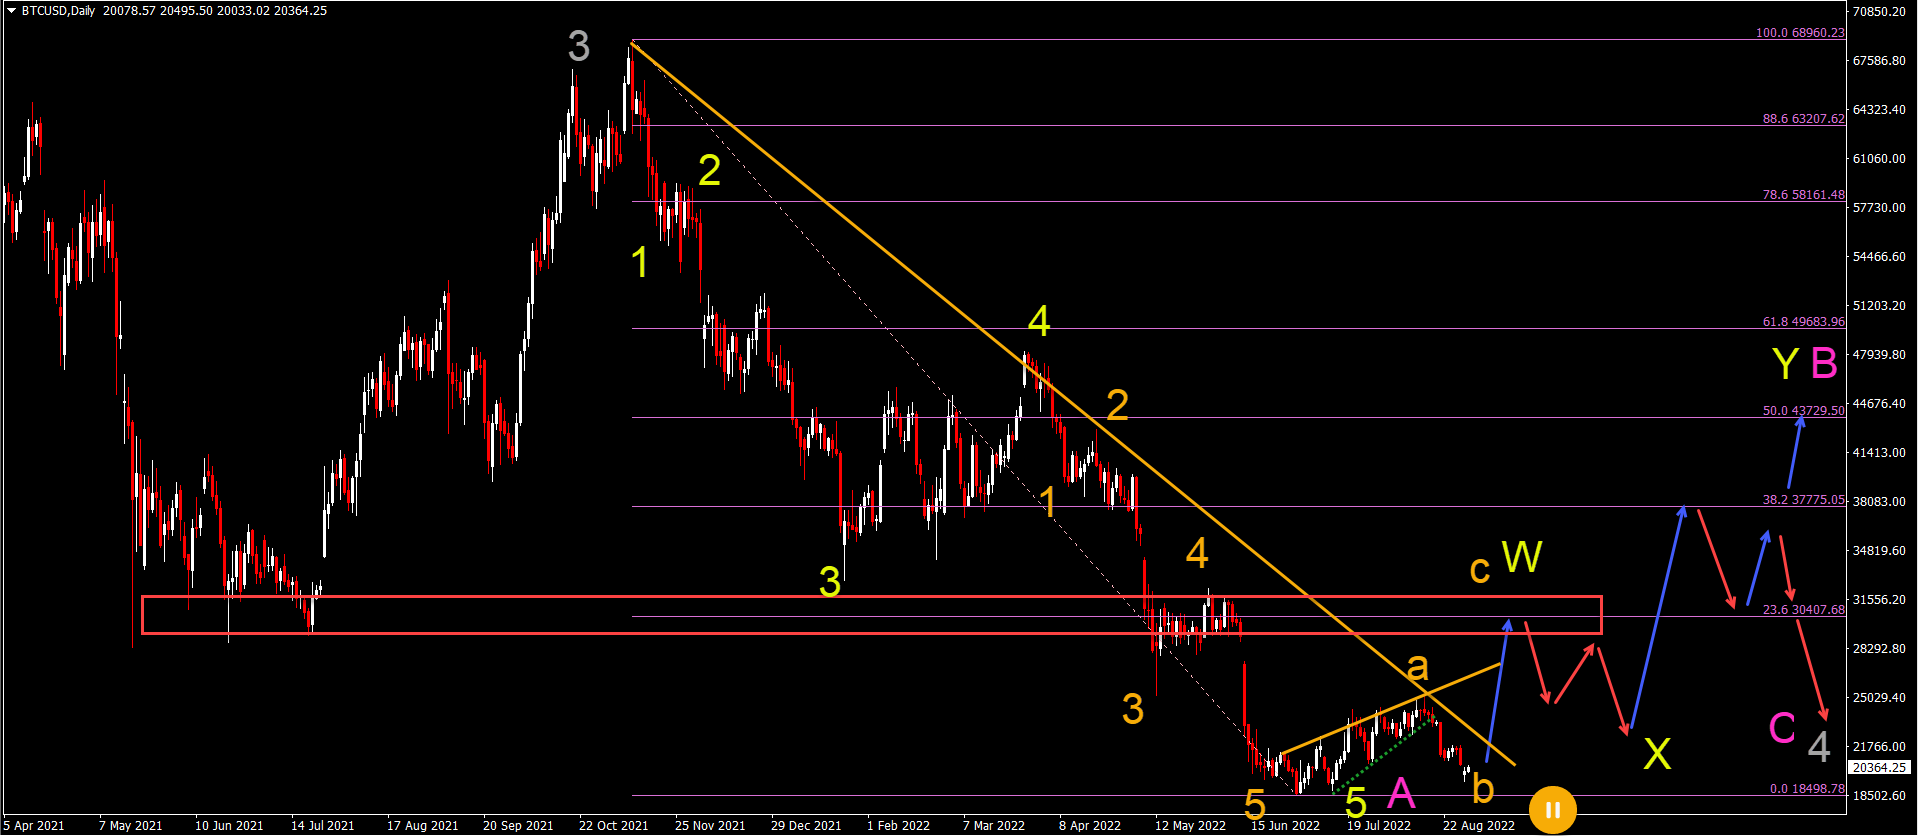
BTC/USD bullish bounce aims at $30k
-
BTC/USD is expected to make a bullish bounce according to our Elliott Wave analysis.
-
The current bearish price action is probably a wave B (orange).
-
This means that a bullish bounce should take price higher within a wave C (orange).
-
A larger ABC (orange) should complete a larger wave W (yellow) of a WXY complex correction (yellow).
-
The main bullish target is the 23.6% Fibonacci level around $30k.
-
A bearish bounce is expected at this strong resistance zone (red box).
-
After a bearish retracement in wave X (yellow), a bullish bounce should take price up towards the 38.2% Fibonacci level in a wave Y (yellow).
The analysis has been done with the indicators and template from the SWAT method simple wave analysis and trading. For more daily technical and wave analysis and updates, sign-up to our newsletter
Author

Chris Svorcik
FS method
Chris Svorcik is a trader, analyst, and educator with over 15 years of experience in financial markets, specializing in moving averages, market structure, and price patterns.


