Weekly waves: EUR/USD, Bitcoin and DAX 30
-
The EUR/USD showed a bullish weekly candle last week. What does it mean for the long-term picture? Let’s review.
-
Bitcoin is building a triangle chart pattern at the moment, which is indicating a lengthy period of consolidation and uncertainty.
-
The DAX 30 chart made a strong decline but also a strong bounce after reaching the 12,500 support zone.

EUR/USD bullish reversal candlesticks on weekly?
-
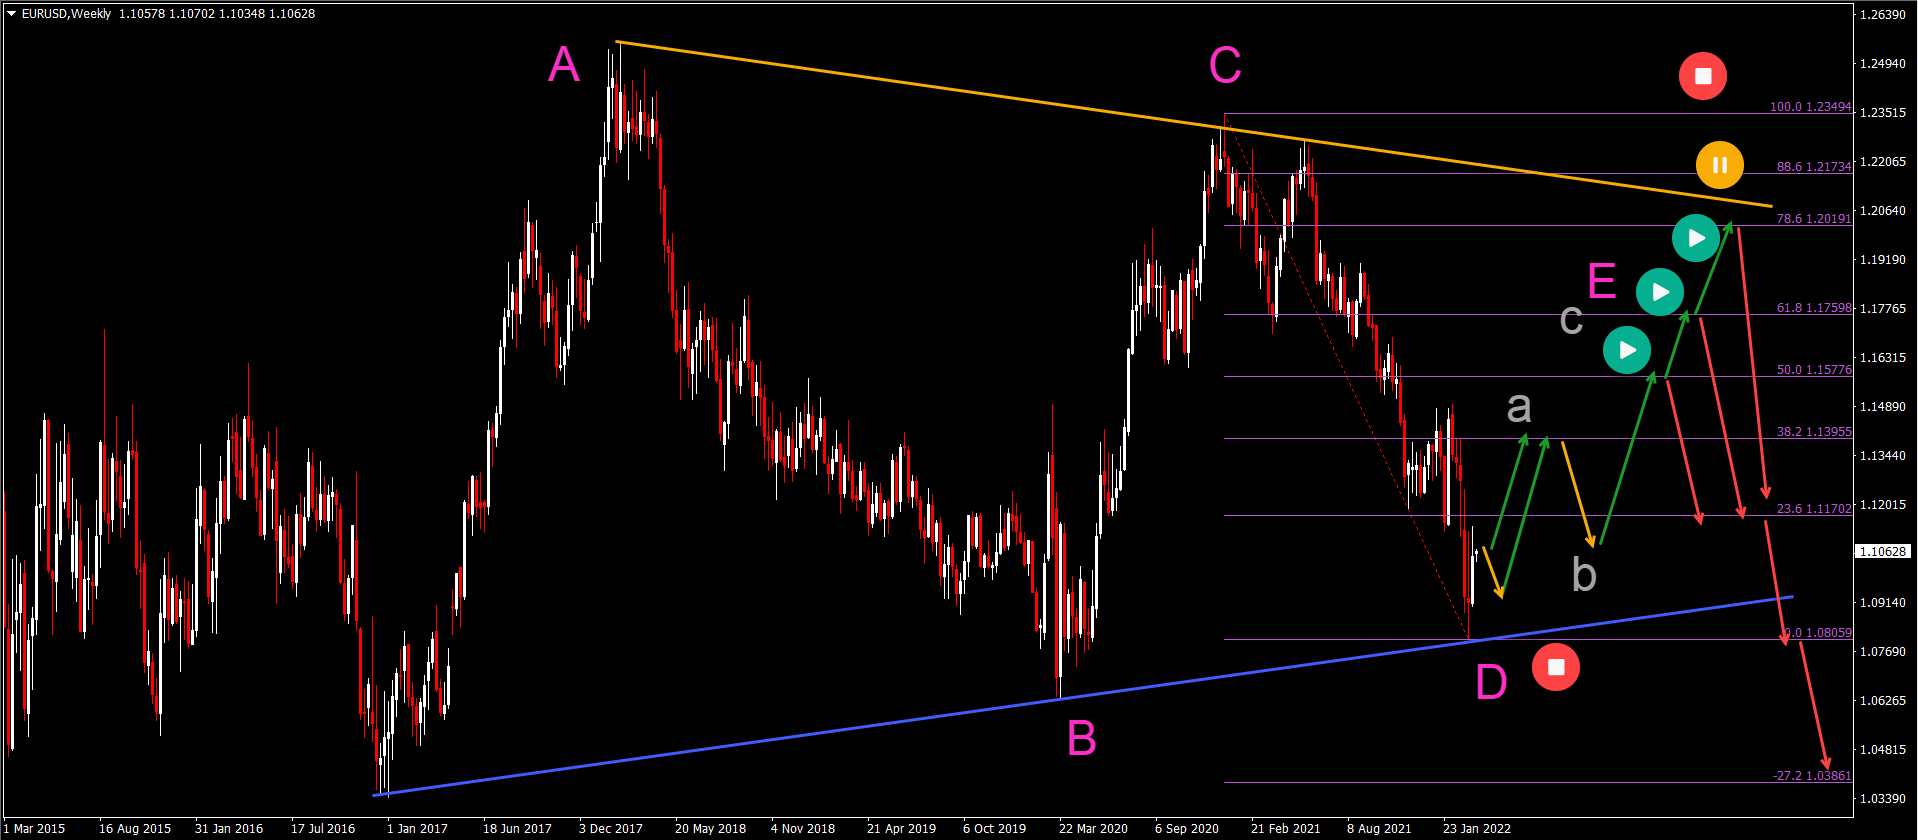
The EUR/USD was unable to break below the previous low and bottom. The bullish bounce created a bullish candlestick pattern on the weekly chart.
-
The bullish reaction could indicate a first signal that a wave D (pink) of a larger ABCDE triangle pattern (pink) is taking place.
-
A bullish ABC (green) pattern in wave E (pink) would confirm it.
-
The wave A (green) will probably reach the 38.2% or 50% Fibonacci level before making a wave B (green) down.
-
The wave E (pink) can bounce (red arrows) at any Fibonacci level of the wave C-D price swing.
-
An immediate break below the bottom invalidates the bullish correction. Whereas a break above the top invalidates the bearish triangle pattern.
BTC/USD bullish triangle chart pattern
-
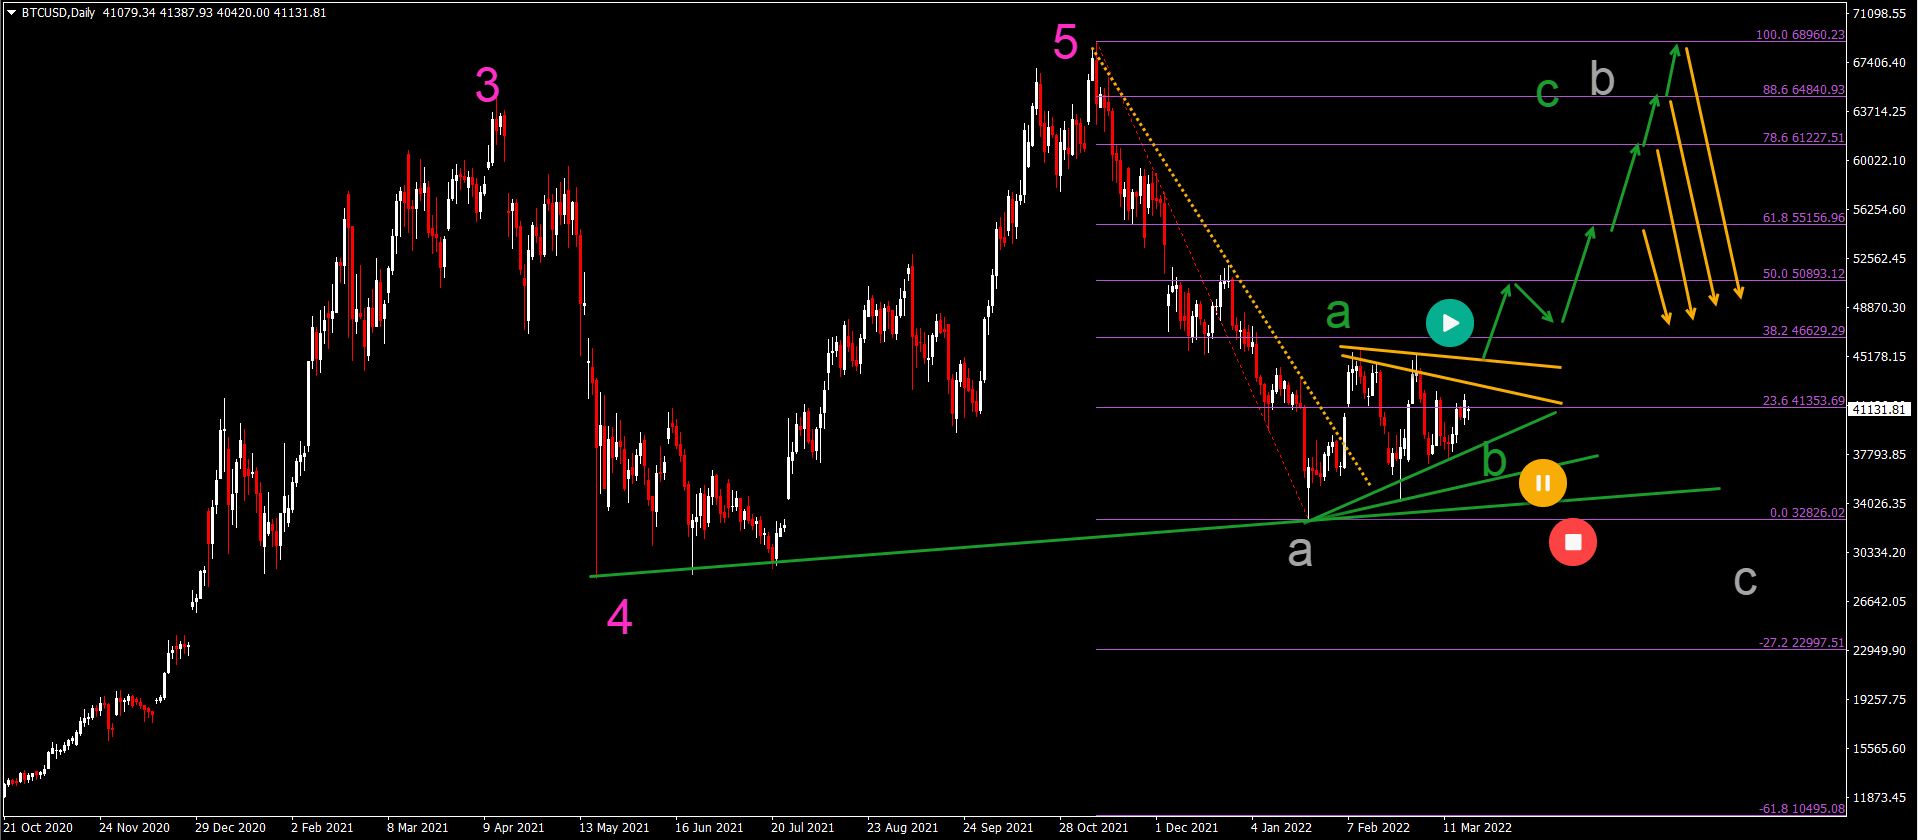
BTC/USD is making lower highs and higher lows. This triangle pattern occurs after a strong bearish price swing (wave A gray).
-
The triangle pattern, however, seems to favor a bullish retracement within wave B (gray).
-
This bullish outlook remains valid as long as price action remains above the support trend lines (green).
-
A break above the resistance (orange lines) could indicate a push up towards the Fibonacci resistance retracement levels and previous top.
-
Those Fib levels and top are expected to be resistance and stop price from rising further.
-
A deep price swing towards the Fibonacci levels could be an ABC flat whereas a shallow move up is an ABC zigzag.
-
An immediate push below the support indicates a downtrend and not a bullish retracement.
DAX 30 bounce could test previous top
-
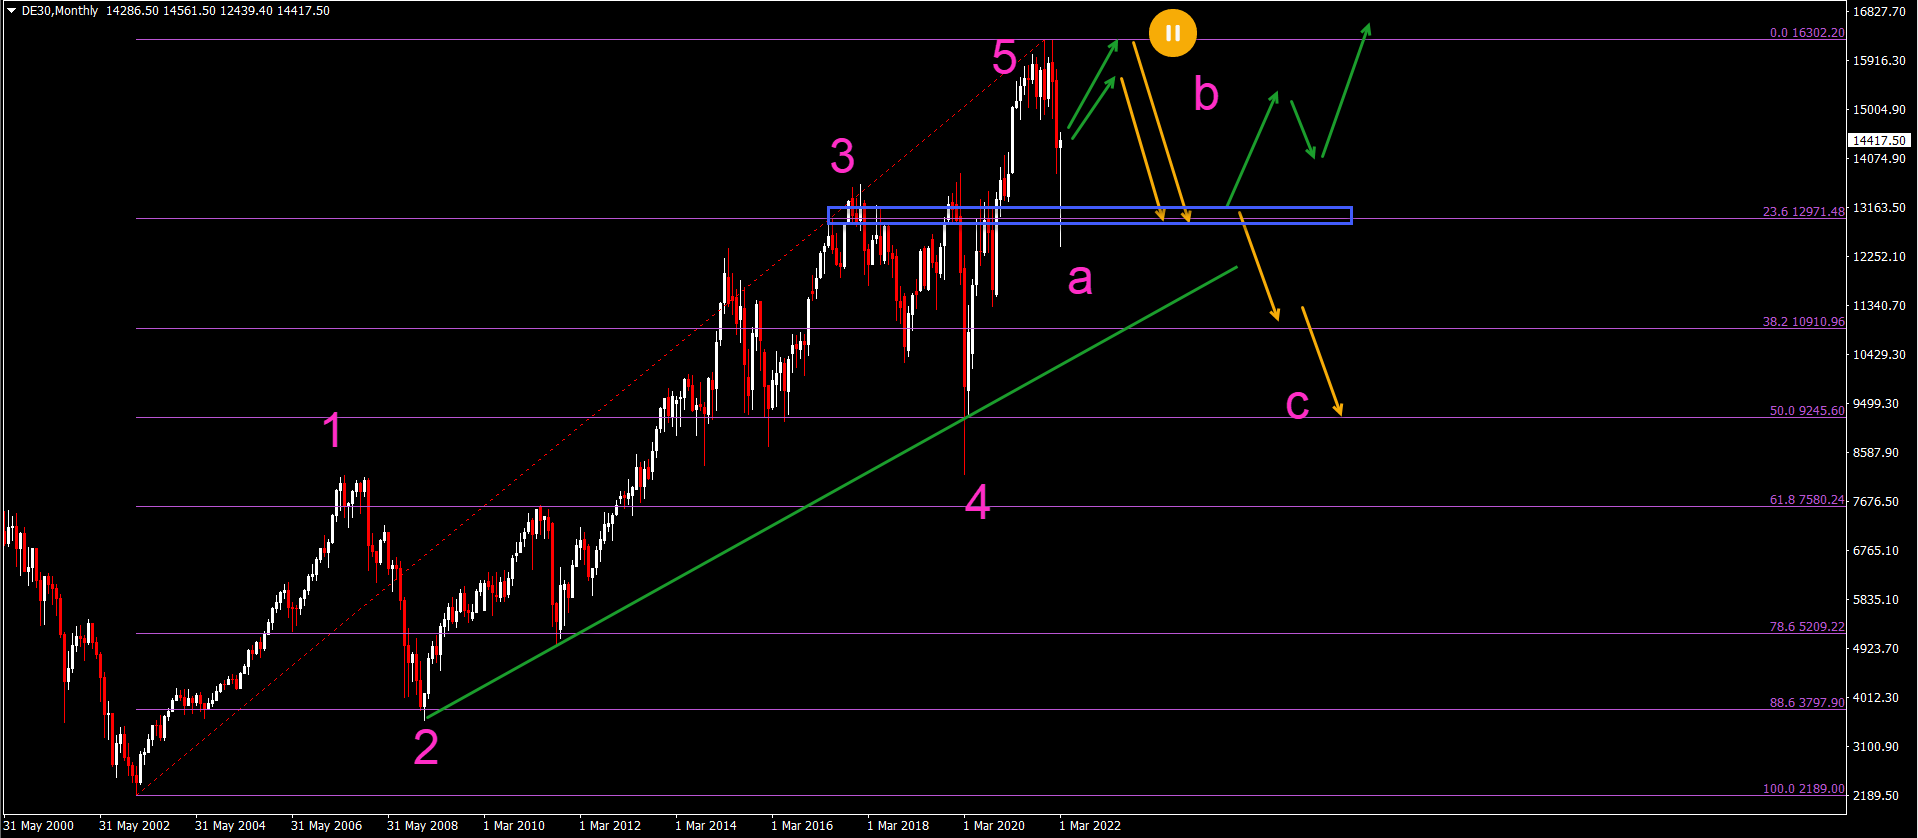
The DAX 30 is probably making a wave B (pink) upwards.
-
The resistance zone and previous top could therefore cap the move up.
-
A bearish bounce at the resistance would confirm this wave analysis.
-
A move down towards the 23.6% would then be expected.
-
The next major support and decision zone is the 23.6% Fibonacci level.
-
A break below the 23.6% Fib could indicate a deep wave C (pink).
-
A bullish bounce could indicate a shallow ABC and more uptrend.
The analysis has been done with the indicators and template from the SWAT method simple wave analysis and trading. For more daily technical and wave analysis and updates, sign-up to our newsletter
Author

Chris Svorcik
FS method
Chris Svorcik is a trader, analyst, and educator with over 15 years of experience in financial markets, specializing in moving averages, market structure, and price patterns.


