Weekly Technical Outlook on Major - USD/JPY

 WEEKLY USD/JPY TECHNICAL OUTLOOK

Last Update At 13 Jan 2020 00:03GMT
Trend Daily Chart
Sideways
Daily Indicators
Turning up
21 HR EMA
109.53
55 HR EMA
109.34
Trend Hourly Chart
Up
Hourly Indicators
Bearish divergences
13 HR RSI
44
14 HR DMI
-ve
Daily Analysis
Consolidation b4 one more rise
Resistance
110.70 - 61.8% r of 114.55-104.46
110.00 - Psychological res
109.72 - Dec's 6-month high (02)
Support
109.24 - Last Wed's high (now sup)
109.01 - Hourly chart
108.62 - Last Tue's high (now sup)
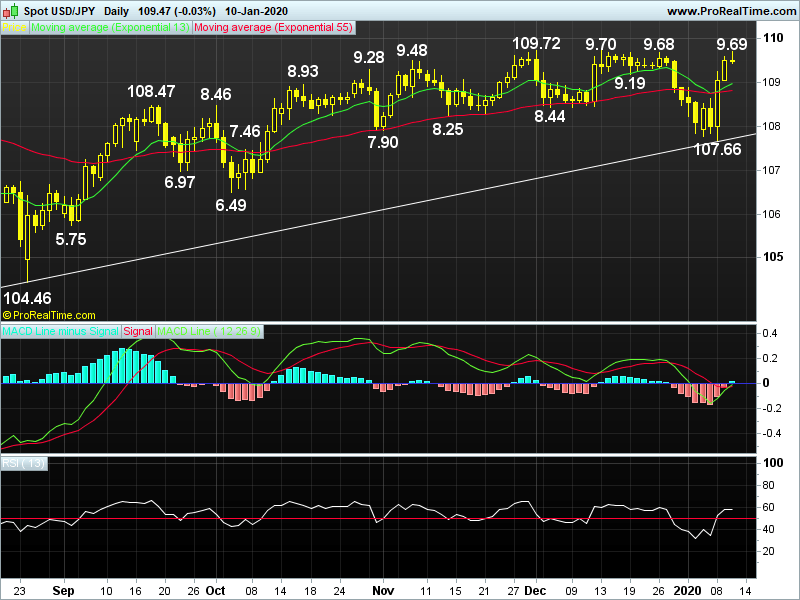
USD/JPY - 109.46.. Although dlr continued its recent losing streak n hit a 12-week 107.66 trough last Wed (AUS) on news of Iran's rocket attacks on US base in Iraq, price rallied on active short covering to as high as 109.69 Fri.
Looking at the bigger picture, dlr's fall fm 118.66 (Dec 2016) to 107.27. in 2017 (Sep) confirms uptrend fm 2016 29-month bottom at 99.00 has made a top. Despite a strg rise fm 2018 16-month bottom at 104.57 to 114.55 in Oct, subse- quent flash crash to a 9-month low at 104.79 in early Jan, then Aug's 33-month bottom at 104.46 suggests correction is over. Despite dlr's fall to a 12-week low of 107.66 last Wed on risk aversion, rally to 109.69 last Fri suggests re- test of 109.72 would be seen next, break would extend MT rise fm 104.46 to 110. 70, 'bearish divergences' on daily indicators shoudl cap price below 111.56 (50% r of 118.66-104.46). Only below 108.62 risks 107.66, then 107.00/10.
Today, despite dlr's impressive rally fm 107.66 (Wed) to 109.69 on Fri due to easing of US/Iran tensions, intra-day retreat after soft U.S. jobs data would bring range trading, reckon 109.24 would contain pullback n bring re-test of Dec's 109.72 peak, abv, 109.90/00. Below 109.00 may risk retrace. twd 108.62.
Author

AceTrader Team
AceTrader
Led by world-renowned technical analyst Wilson Leung, we have a team of 7 analysts monitoring the market and updating our recommendations and commentaries 24 hours a day.


