Weekly technical market insight

Note: Charts provided by Trading View
EUR/USD:
Monthly timeframe:
(Technical change on this timeframe is often limited, though serves as guidance to potential longer-term moves)
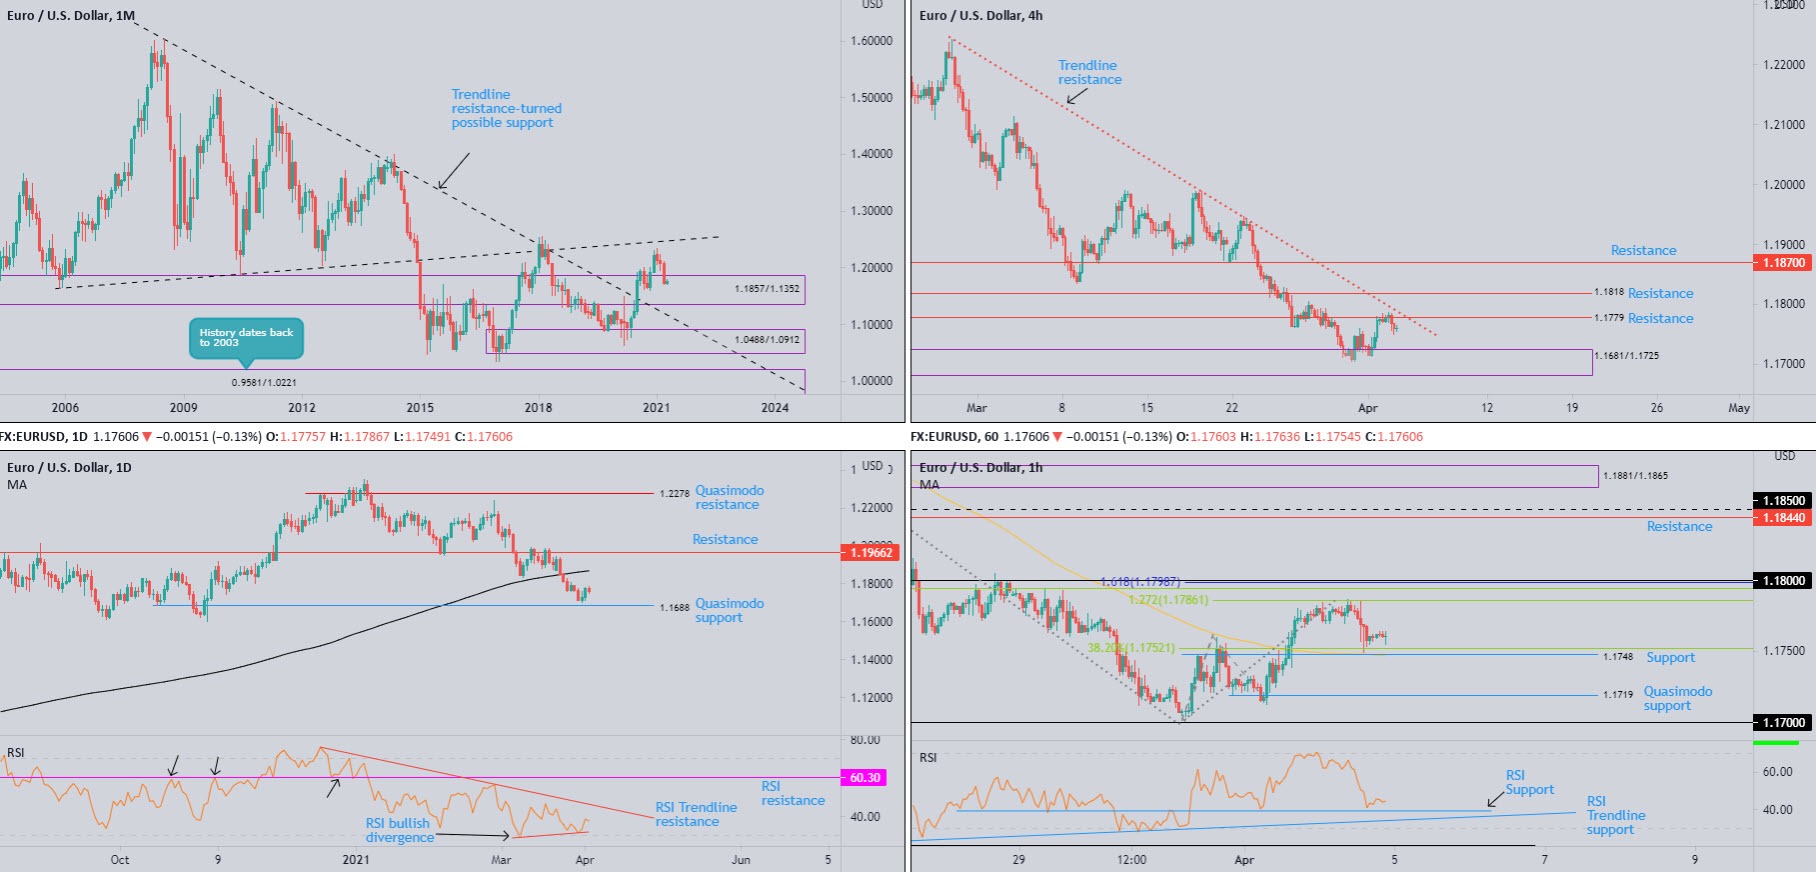
March carved out a third consecutive loss, extending the 2021 retracement slide by 2.8 percent.
Recent underperformance, as you can see, pulled EUR/USD into the walls of demand at 1.1857/1.1352.
A rebound from the aforesaid demand shifts attention to the possibility of fresh 2021 peaks and a test of ascending resistance (prior support – 1.1641). Extending lower, on the other hand, shines the technical spotlight on trendline resistance-turned support, taken from the high 1.6038.
In terms of trend, the primary uptrend has been underway since price broke the 1.1714 high (Aug 2015) in July 2017.
Daily timeframe:
A closer assessment of price action on the daily timeframe reveals last week bottomed a few pips north of Quasimodo support from 1.1688.
To the upside, technical analysts will note the 200-day simple moving average roaming around the 1.1870 neighbourhood. Therefore, this dynamic value is perhaps targeted resistance this week.
As for trend on the daily scale, we’ve been higher since early 2020.
On the basis of the RSI oscillator, the value made some progress above oversold space in recent trading, following the formation of bullish divergence. The 50.00 centreline is plotted nearby, followed by trendline resistance, drawn from the peak 76.00.
H4 timeframe:
As can be seen from the H4 chart last week, price movement discovered healthy bids around demand at 1.1681/1.1725 (houses daily Quasimodo support at 1.1688 within) and elevated the currency pair to resistance at 1.1779. Although 1.1779 served sellers well on Friday, increased upside this week could pull in another layer of resistance at 1.1818.
Technical elements also demonstrate a neighbouring trendline resistance calls for attention, extended from the high 1.2242.
H1 timeframe:
Early London Friday, despite holiday-thinned conditions, shook hands with a 1.272% Fib extension at 1.1786 and, heading into the US session, dived for an interesting area of short-term support around 1.1750 (made up of 1.1748 support [previous Quasimodo resistance], a 38.2% Fib retracement at 1.1752 and the 100-period simple moving average).
Below said supports, Quasimodo structure is present around 1.1719, closely followed by 1.17. Interestingly, above the 1.272% Fib extension at 1.1786, chart space reveals the 1.18 figure, surrounded by a 1.618% Fib projection at 1.1798 and a 50.0% retracement value at 1.1794.
RSI movement, as you can see, settled just ahead of support at 39.00, joined closely by trendline support, taken from the low 20.50.
Observed levels:
Longer-term action, based on the monthly timeframe, reveals buyers could make an appearance within demand at 1.1857/1.1352, despite dominant selling witnessed in March. From the daily scale, a test of Quasimodo support at 1.1688 could materialise, with bullish bets targeting the 200-day simple moving average.
Short-term trading shows H4 rejecting resistance at 1.1779, though at the same time H1 defends support around 1.1750, bolstered by local technical confluence.
AUD/USD:
Monthly timeframe:
(Technical change on this timeframe is often limited, though serves as guidance to potential longer-term moves)
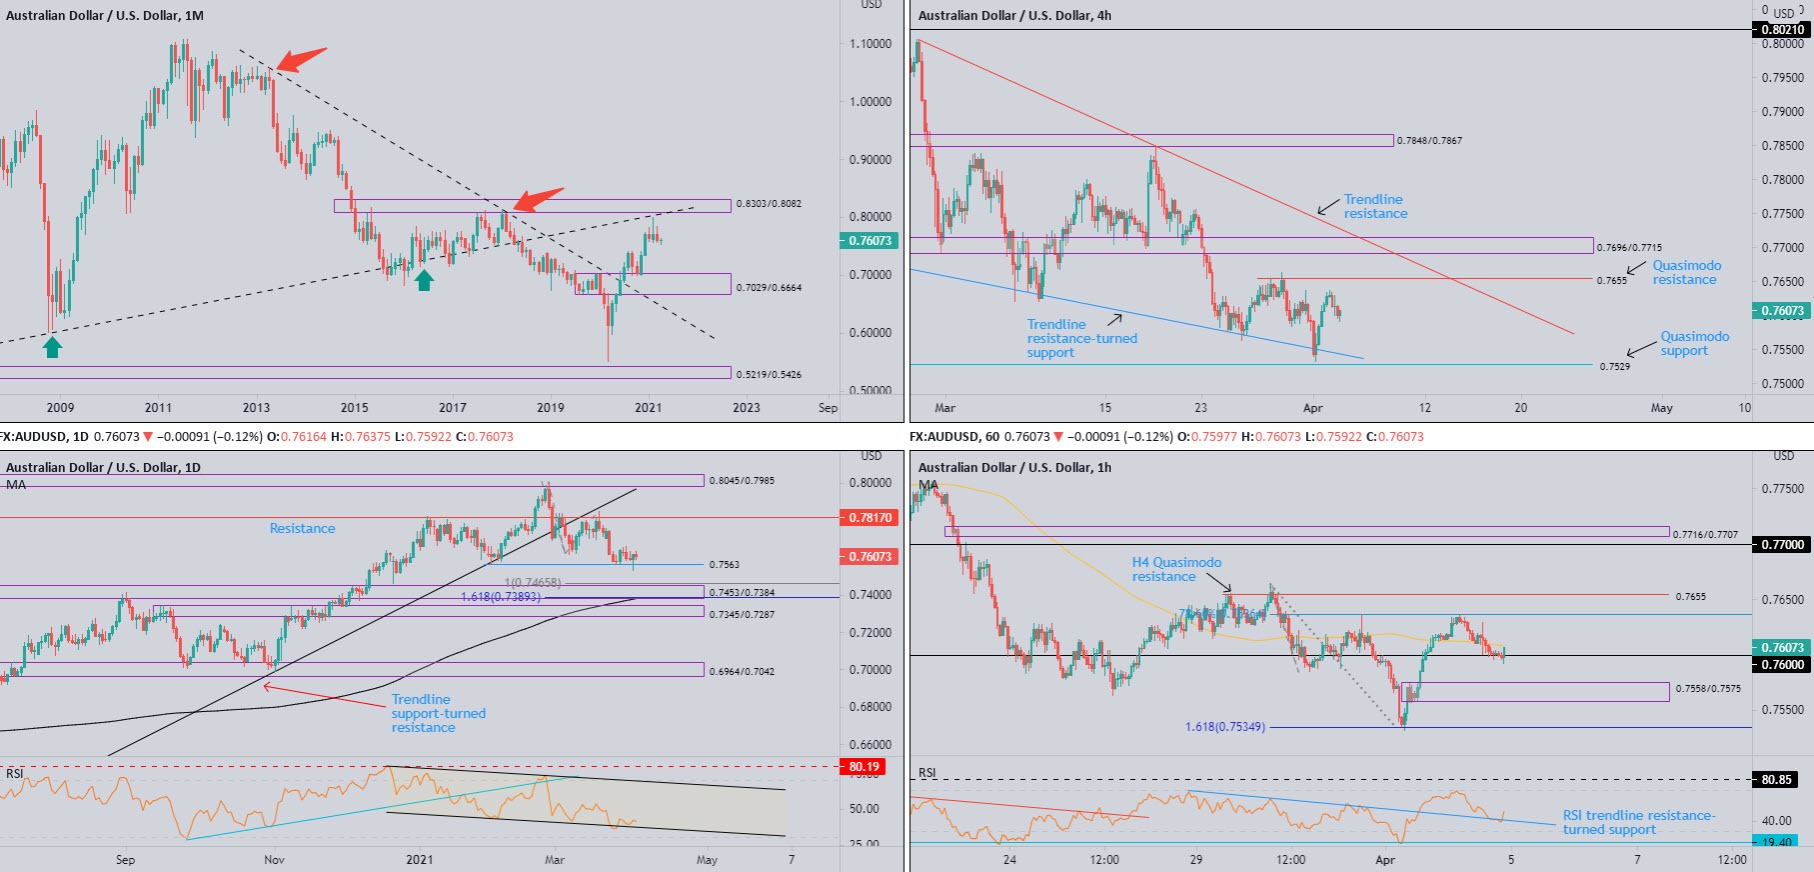
February finished considerably off best levels, establishing what many candlestick fans call a shooting star pattern—a bearish signal found at peaks. What’s interesting was February also came within striking distance of trendline resistance (prior support - 0.4776), sheltered under supply from 0.8303/0.8082.
March erased 1.5% over the Month and probed February’s lows. Should subsequent Months take the reins, demand is in view at 0.7029/0.6664 (prior supply).
With respect to trend (despite the trendline resistance [1.0582] breach in July 2020), the primary downtrend (since mid-2011) remains in play until breaking 0.8135 (January high [2018]).
Daily timeframe:
The 0.7563 February low, as you can see, delivered supportive structure heading into the closing stages of March, with Thursday pencilling in a clear-cut hammer pattern—typically viewed as a bullish signal at troughs.
An extension to the upside over the coming week shines light on resistance at 0.7817, while sellers regaining consciousness could have price take aim at demand from 0.7453/0.7384 (dovetailing closely with a 100% Fib extension at 0.7465 and a 1.618% Fib projection at 0.7389). Technicians will also note the 200-day simple moving average circling nearby at 0.7383.
Trend studies reveal the unit has been higher since early 2020.
As for the RSI oscillator, the value remains supported around channel support, taken from the low 43.70.
H4 timeframe:
Thursday witnessed the currency pair touch gloves with trendline resistance-turned support, etched from the high 0.7805, missing Quasimodo support at 0.7529 by a whisker before changing gear and advancing higher.
Despite a modest retracement forming on Friday, Quasimodo resistance at 0.7655 remains stationed nearby. Additional resistance can be seen at 0.7696/0.7715, alongside a trendline resistance, printed from the high 0.8007.
H1 timeframe:
Following an earlier push from a 78.6% Fib level at 0.7636 (sited just south of H4 Quasimodo resistance at 0.7655), Friday settled lower by 0.1 percent and crossed swords with the 0.76 figure (forming a bullish outside reversal). Continuation buying could take price above the 100-period simple moving average at 0.7608.
Demand at 0.7558/0.7575 is next in sight should 0.76 give way this week.
The view out of the RSI shows the value testing trendline resistance-turned support (taken from the high 69.00), following a decisive drop through the 50.00 centreline.
Observed levels:
Longer-term action has the monthly timeframe pointing to possible weakness over the coming months; yet, on the other hand, daily price recently discovered support around 0.7563 and established a bullish candlestick signal.
Short-term flow has H1 toying with 0.76 support, with a push above the 100-period simple moving average likely to draw additional upside. A break lower, however, unmasks demand at 0.7558/0.7575 (holds daily support within at 0.7563).
On the H4, the unit appears to have room to rally until testing Quasimodo resistance at 0.7655.
USD/JPY:
Monthly timeframe:
(Technical change on this timeframe is often limited, though serves as guidance to potential longer-term moves)
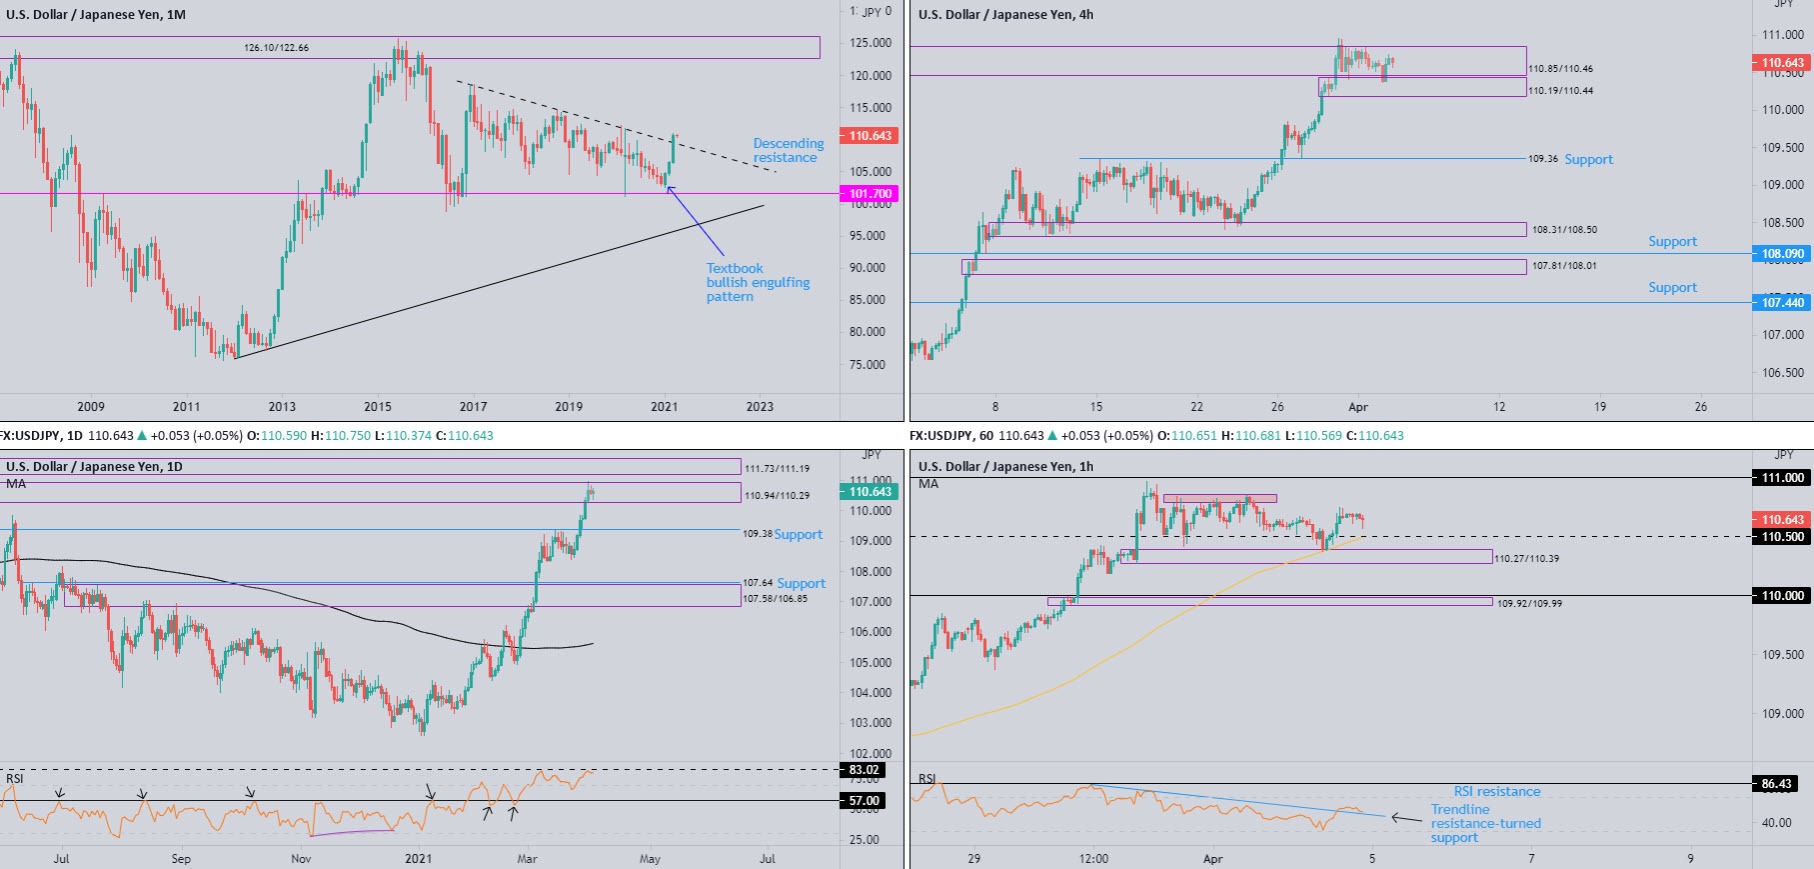
Following January’s bullish engulfing candle and February’s outperformance, March concluded up by 3.9 percent and marginally cut through descending resistance, etched from the high 118.66. Any sustained upside highlights the possibility of continuation moves to as far north as 126.10/122.66 supply.
To the downside, support inhabits 101.70.
Daily timeframe:
Largely unchanged from previous analysis.
Supply at 110.94/110.29—an area sharing a close connection with the monthly timeframe’s descending resistance—is under siege. Subsequent outperformance this week shines light on supply at 111.73/111.19.
Should sellers make an appearance, support at 109.38 represents a possible target: a previous Quasimodo resistance.
In terms of trend on the daily scale, we have been decisively higher since early 2021.
Latest developments also witnessed the RSI climb within overbought terrain and end the session on the doorstep of resistance at 83.02.
H4 timeframe:
Buyers continued to guard demand at 110.19/110.44. This is an important zone given within this area a decision was made to push beyond supply at 110.85/110.46 (housed within daily supply at 110.94/110.29).
This echoes strength and reinforces the possibility of further upside this week, potentially setting the stage for an approach to Quasimodo resistance at 111.60.
H1 timeframe:
Heading into the early hours of London on Friday, price action dropped through 110.50 support and challenged demand at 110.27/110.39 (this demand was notable, representing a decision point to breach offers around 110.50). Bolstered by the 100-period simple moving average, price subsequently reclaimed 110.50+ status and tested peaks at 110.74.
Assuming buyers remain in the frame, modest resistance at 110.80 is visible (red), with a break unveiling the 111 figure.
From the RSI oscillator, trendline resistance, pencilled in from the peak 84.78, was breached Friday. This—coupled with the 50.00 centreline giving way—echoes a possible visit to overbought territory this week.
Observed levels:
Monthly descending resistance giving way, together with daily supply at 110.94/110.29 echoing a fragile tone, suggests USD/JPY bulls may attempt to climb this week.
The above, coupled with H4 demand holding at 110.19/110.44, places H4 supply at 110.85/110.46 in a difficult situation. This also positions any H1 buyers north of 110.50 in a healthy setting early week, possibly targeting 111.
GBP/USD:
Monthly timeframe:
(Technical change on this timeframe is often limited, though serves as guidance to potential longer-term moves)
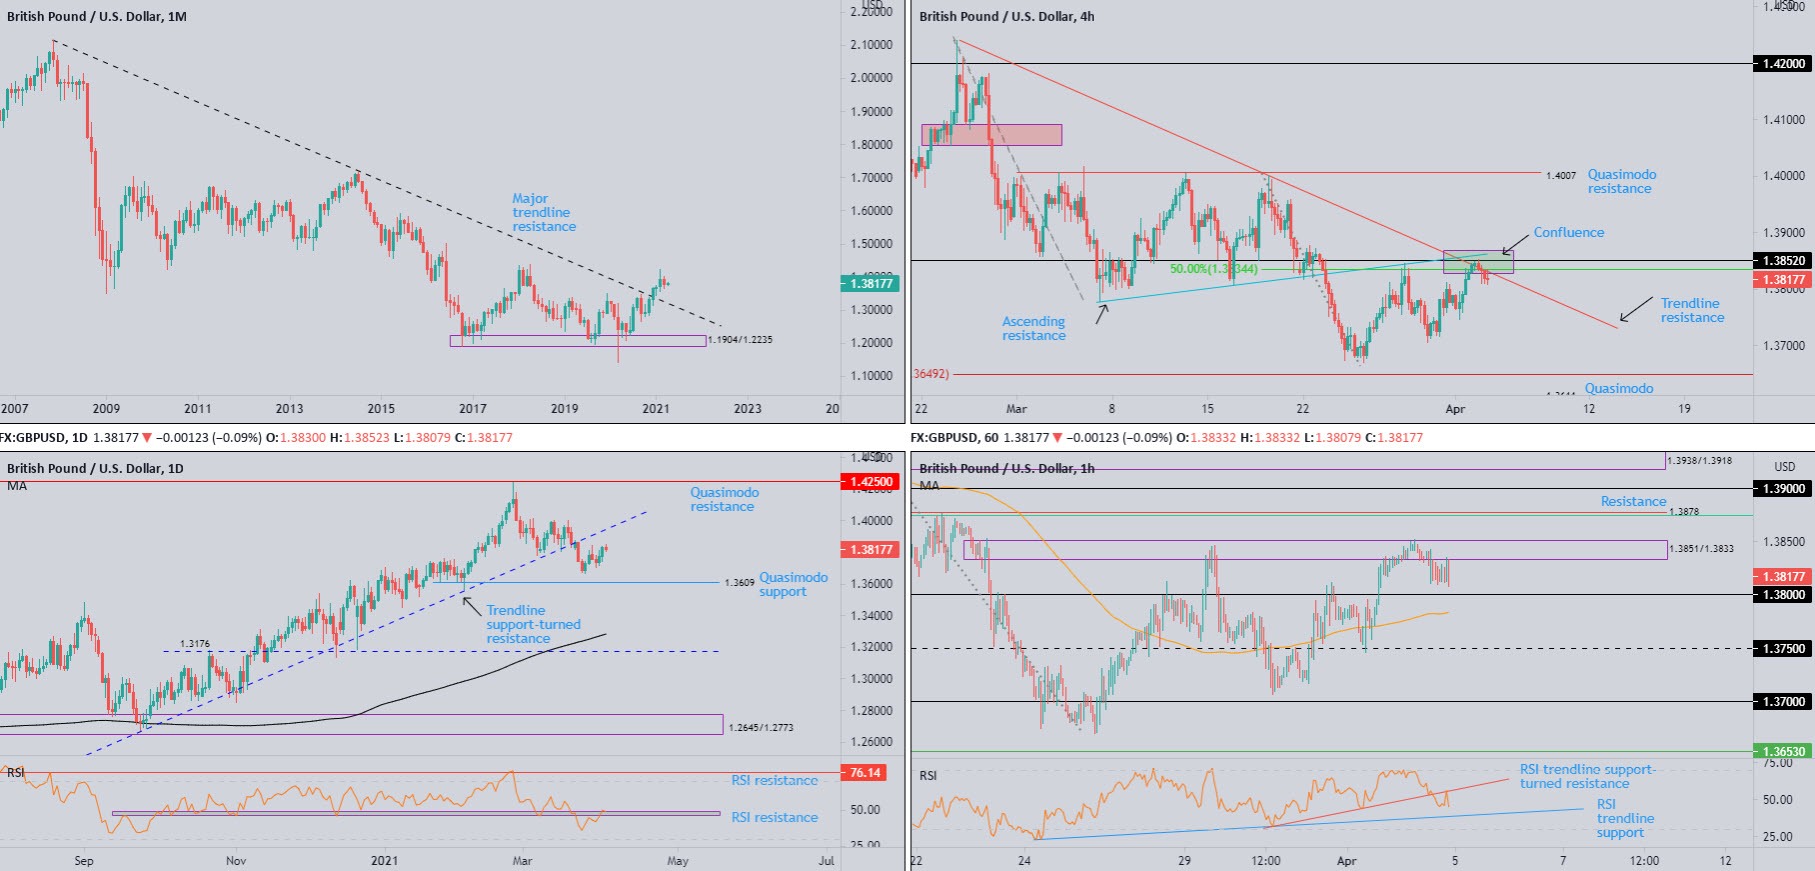
The pendulum swung in favour of buyers following December’s 2.5 percent advance, stirring major trendline resistance (2.1161). February followed through to the upside (1.7 percent) and refreshed 2021 highs at 1.4241, levels not seen since 2018. Contained within February’s range, however, March snapped a five-month winning streak and formed what candlestick enthusiasts call an inside pattern—represents a short-term consolidation with low volatility. A breakout lower tends to be considered a bearish signal.
Despite the trendline breach, primary trend structure has faced lower since early 2008, unbroken (as of current price) until 1.4376 gives way (April high 2018).
Daily timeframe:
Unchanged from previous analysis.
Technical structure shows Quasimodo support at 1.3609 calls for attention to the downside, while upriver we can see trendline support-turned resistance, extended from the low 1.1409.
Despite the trendline break, GBP/USD has been trending higher since early 2020.
RSI action has the value testing familiar resistance between 46.21 and 49.16.
H4 timeframe:
For those who read recent technical writing you may recall the following (italics):
The spotlight shines on resistance at 1.3852, a level joined by an ascending resistance, taken from the low 1.3778, a 50.0% retracement at 1.3834 and trendline resistance, drawn from the high 1.4241 (green).
As you can see, price tested 1.3850 confluence and sellers made a modest showing on Friday.
H1 timeframe:
Supply at 1.3851/1.3833 remained in the frame Friday, an area that held price lower early last week.
Lower on the curve, the 1.38 figure is seen, closely followed by the 100-period simple moving average around 1.3783.
Above the aforesaid supply, we can see resistance parked at 1.3878, alongside the 61.8% Fib level at 1.3875 (green).
RSI action tested trendline support-turned resistance (taken from the low 32.14) and closed under the 50.00 centreline on Friday. Further downside targets trendline support, drawn from the low 23.30.
Observed levels:
Longer term, the monthly timeframe shows price recently pencilled in an inside pattern. Though before sellers step in (if at all), this week could have daily price retest trendline support-turned resistance.
Shorter-term charts show H4 rejecting resistance at 1.3852. Not only does the level share space with additional H4 resistances, H1 supply is noted nearby at 1.3851/1.3833. Therefore, early week may have sellers make a show and attempt to overthrow 1.38 and the 100-period simple moving average on the H1.
Premium
You have reached your limit of 3 free articles for this month.
Start your subscription and get access to all our original articles.
Author

Aaron Hill
FP Markets
After completing his Bachelor’s degree in English and Creative Writing in the UK, and subsequently spending a handful of years teaching English as a foreign language teacher around Asia, Aaron was introduced to financial trading,


