Weekly preview: Technical analysis on USD/JPY, GBP/USD, USD/CNH, XAU/USD, WTI, SPX

This week, equities slumped after a rout on Wall Street, as uncertainty crept back into the markets as to whether the recovery is sustainable, in face of continuing concerns about the second wave of infections. Meanwhile, DXY benefitted from the risk aversion while Gold prices remain depressed as downward pressure from the dollar strength countered demand for the safe haven currency. Elsewhere, oil prices dipped as investors tread with caution.
CURRENCY: USD/JPY
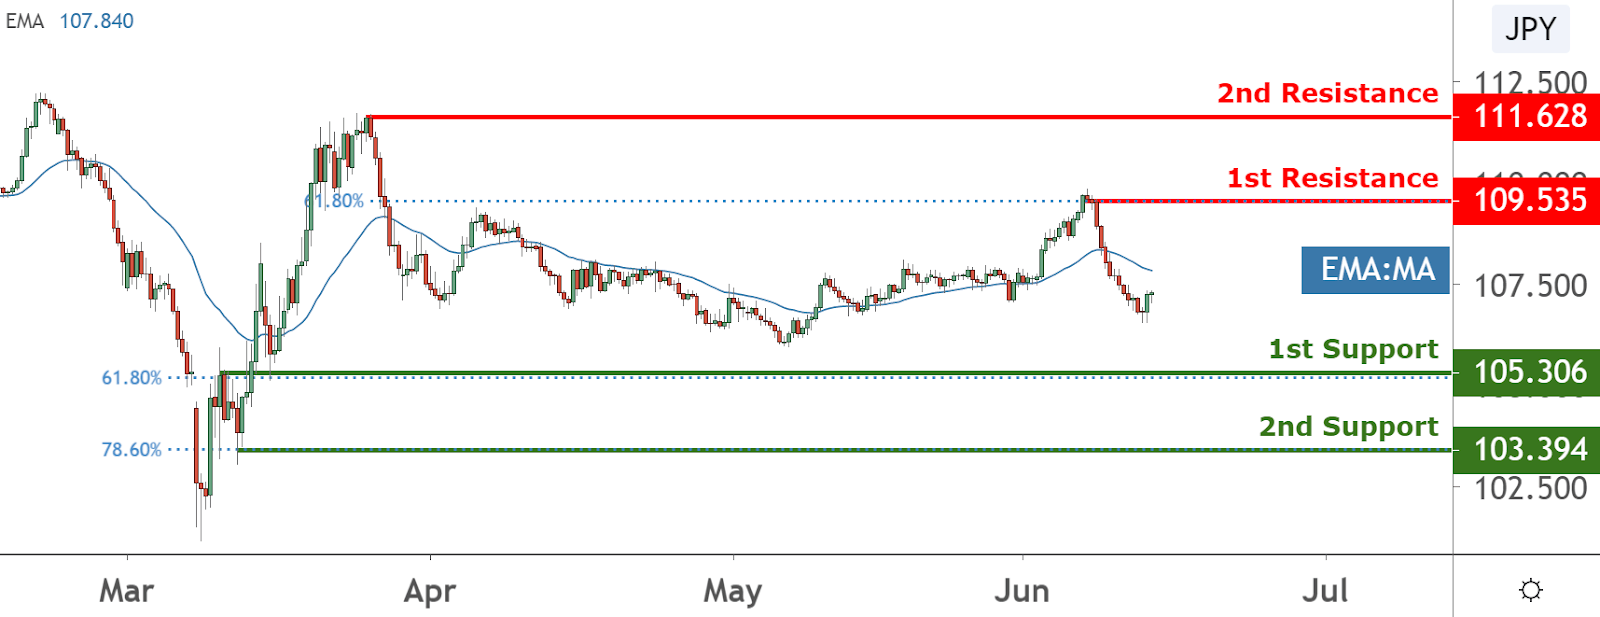
Chart by TradingView.com
Price is in the middle of 1st support and 1st resistance where the 61.8% fibonacci retracement is .The 1st support level happens to where the horizontal overlap support lines up with 61.8% fib retracement. Take caution that EMA shows that price is holding below the EMA(34) and the sentiment is bearish.
CURRENCY: GBP/USD
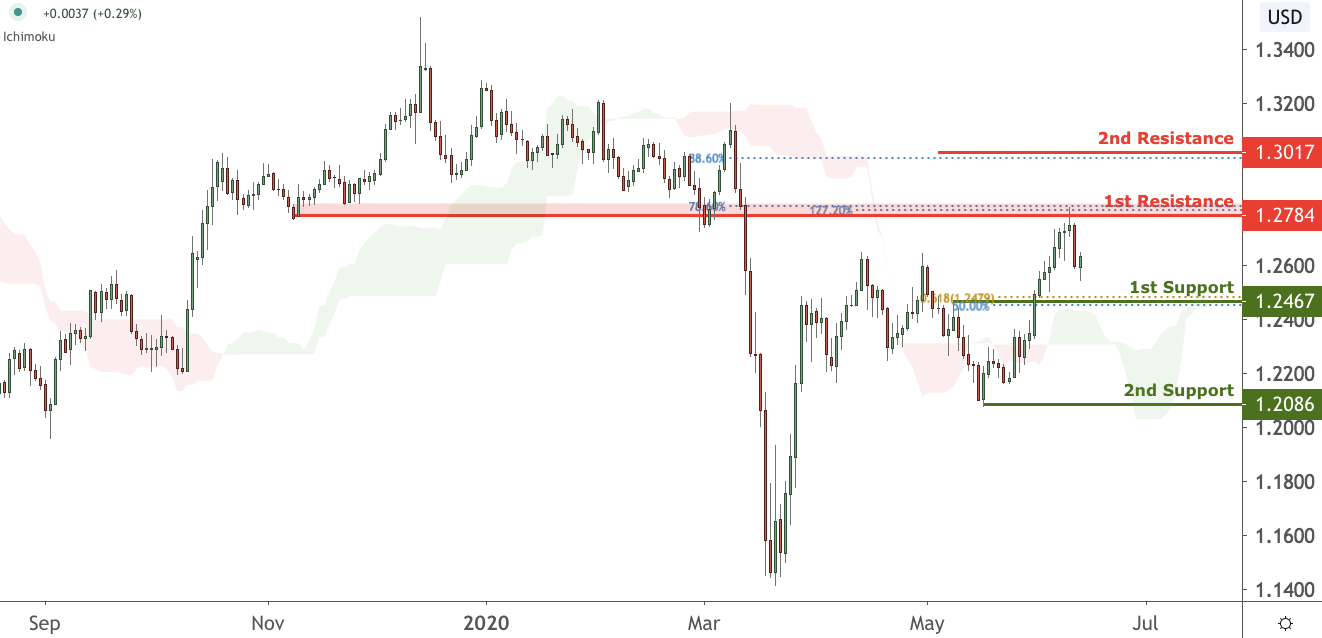
Chart by TradingView.com
Price is bullish pressure from our first support level, in line with our horizontal pullback support, 61.8% fibonacci extension and 50% fibonacci retracement where we could see a bounce to our first resistance level. Ichimoku cloud is showing signs of bullish pressure, in line with our bullish bias.
CURRENCY: USD/CNH
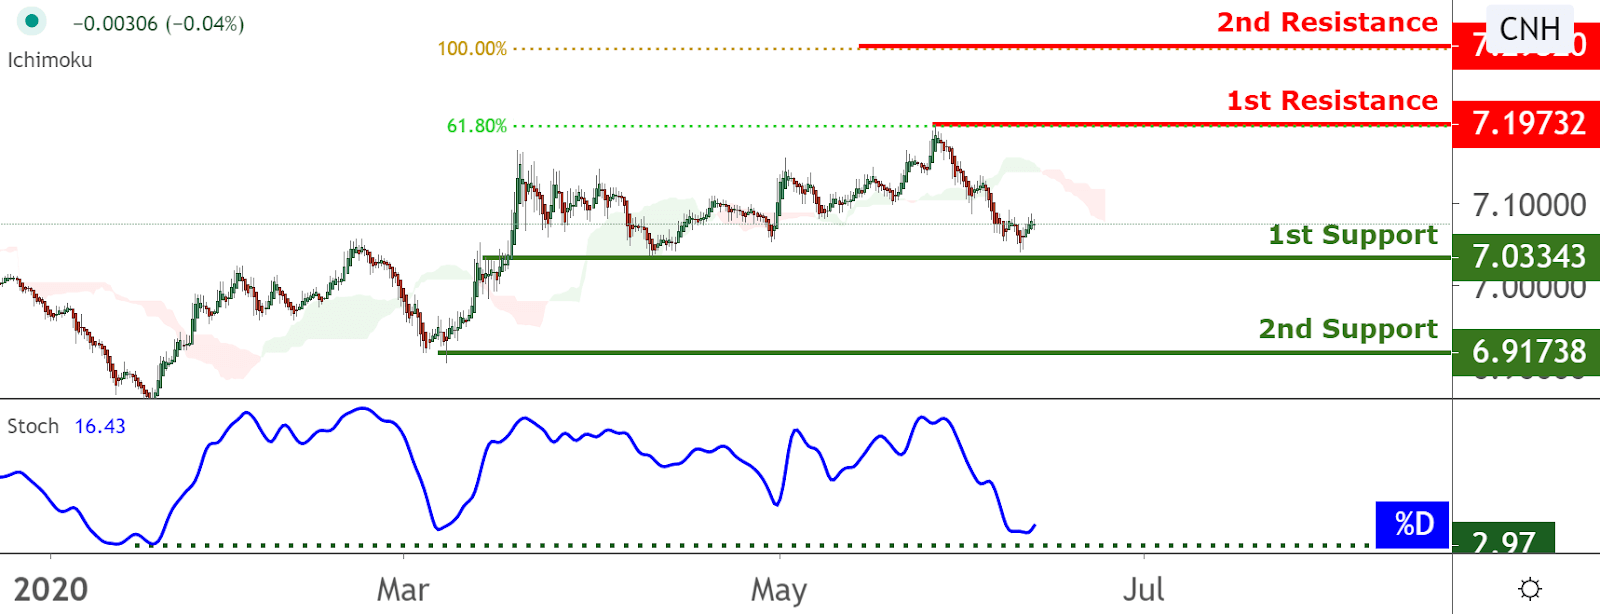
Chart by TradingView.com
Price is approaching 1st support which is in line with our horizontal swing low. Stochastic is showing signs of bullish sentiment. Take caution that the Ichimoku cloud is showing signs of bearish pressure for prices to make a pushdown.
CURRENCY: SPX
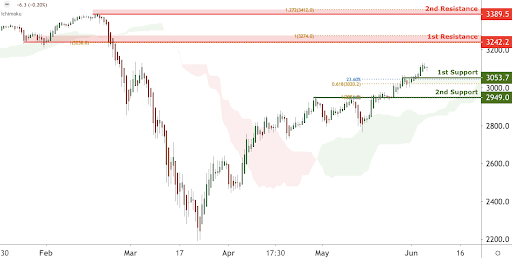
Chart by TradingView.com
Price is facing bullish pressure from our first support, in line with our 61.8% fibonacci retracement and 161.8% fibonacci extension where we could see a bounce to our first resistance level. Ichimoku cloud is showing signs of bullish pressure in line with our bullish bias.
CURRENCY: XAU/USD
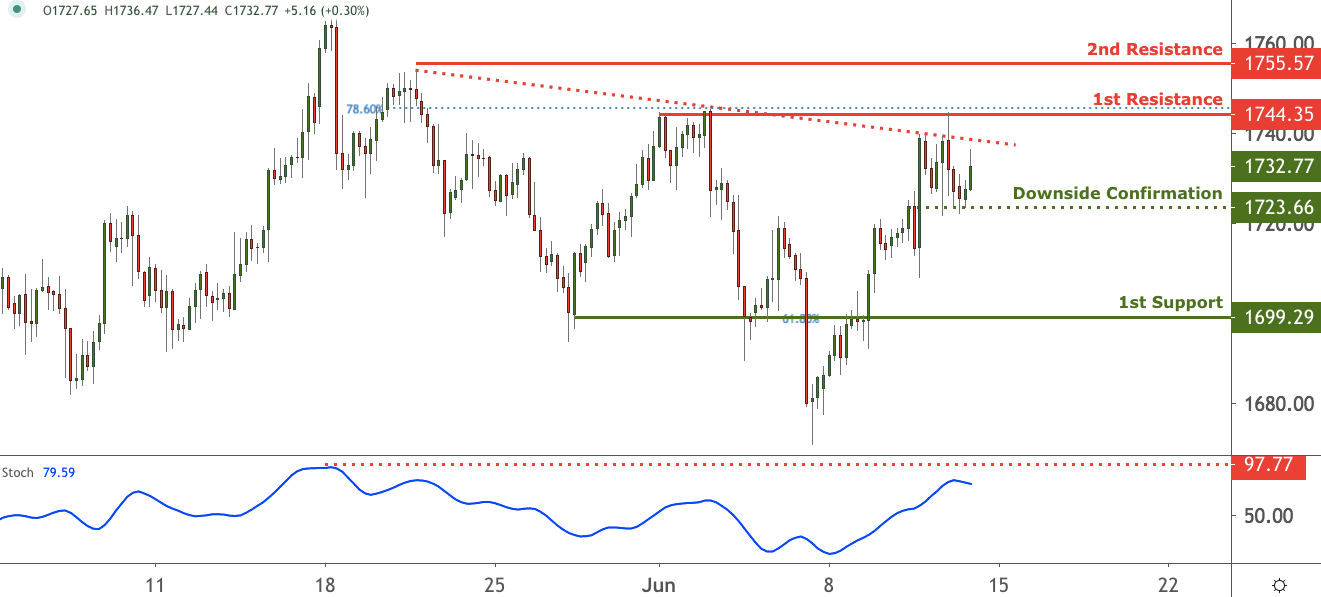
Chart by TradingView.com
Price is facing bearish pressure from our first resistance, in line with our descending trend line, horizontal swing high resistance and 78.6% fibonacci retracement where we remain bearish below this level. A break below our downside confirmation level could provide the bearish acceleration to our first support level. Stochastic is approaching our resistance as well.
CURRENCY: WTIUSD (USOIL)
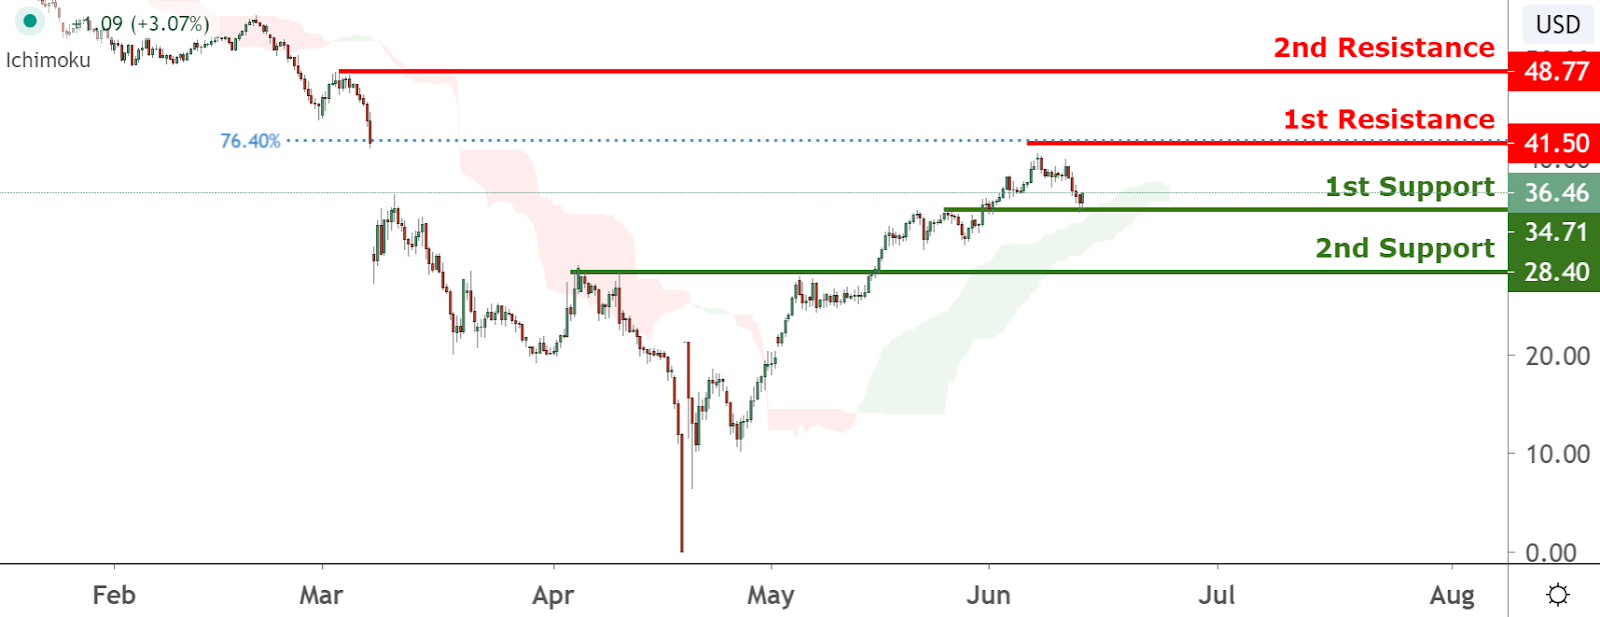
Chart by TradingView.com
Price is approaching 1st support which is in line with our horizontal overlap support. Ichimoku cloud is also showing signs of bullish momentum to come. 1st resistance is where the 76.4% fibonacci retracement is and is likely to be an upside targets for long trades.
Author

Desmond Leong runs an award-winning research firm producing institution-grade forecasts for the largest brokers, hedge funds and banks.


