Weekly preview: Double witching hour

For I have known them all already, known them all:
Have known the evenings, mornings, afternoons,
I have measured out my life with coffee spoons…
The Love Song of J. Alfred Prufrock
I certainly have drunk a lot of coffee in my life, but when I think of measuring out my life, at least my working life, I don’t think of coffee spoons – I think of nonfarm payrolls (NFP).
The “indicator du jour” when I started out in this field back in the 1980s wasn’t the NFP – it was the weekly US money supply figures. If I remember correctly, they were released on a Saturday morning so as not to disturb the markets. Now no pays any attention to money supply data, not even the European Central Bank, which supposedly has it as one of the three “pillars” of its policy. For a time the US trade figures roiled the markets monthly – now Bloomberg gives the US merchandise trade figure a “relevance score” of a mere 7 out of 100 (meaning something like only 7% of the people who get alerts on US indicators get alerts for this one).
This coming week we have the nonfarm payrolls, which scores 99.21 out of 100 –the highest of any regular indicator I could find, even higher than the Fed rate decision @ 97.64. Usually, the NFP is the first Friday of the month, but this coming week the first Friday is a holiday – the US is taking the Fourth of July (Independence Day) off a day early since the fourth is a Saturday. That means the NFP will be announced on Thursday, at the same time as the initial jobless claims (98.43) and continuing claims. Since the COVID-19 virus hit, these two have to some degree supplanted – or perhaps augmented – the NFP as the main US indicator, in that they give a more up-to-the-minute picture of the employment situation.
This past week’s jobless claims contained some bad news, some good news and some terrible news. The bad news was that the rate of decline in jobless claims has stalled. Claims this week were only 60k less than the previous week, when they were only 26k less than the week before. This compares with -331k and -226k in the previous two weeks. So initial jobless claims seem to be plateauing out at around 1.5mn people – 14 weeks into this disaster, 1.5mn people a week are still losing their jobs. One might have hoped that with many areas opening up again, job losses would be slowing more than this, but no.
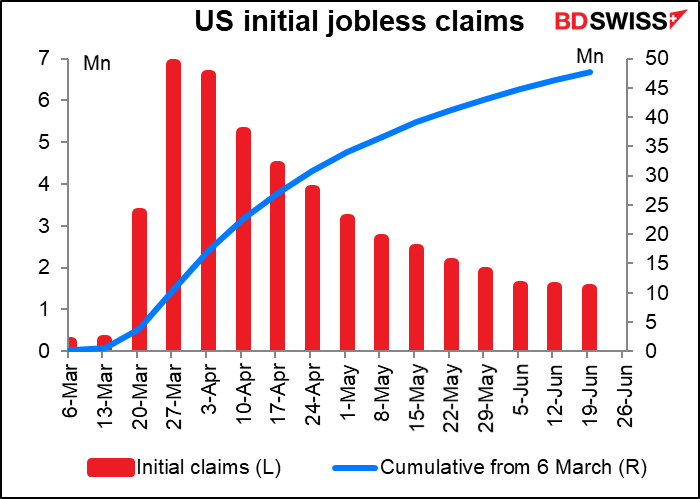
The good news – well, kind of good – is that continuing claims continue to decline, albeit slightly. That means even if 1.5mn people are losing their jobs every week, more people are getting new jobs. In the latest week the decline was 767k, so a sizeable number.
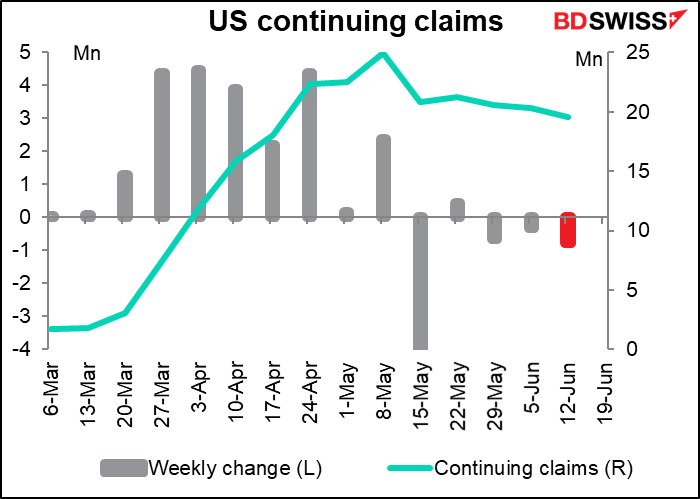
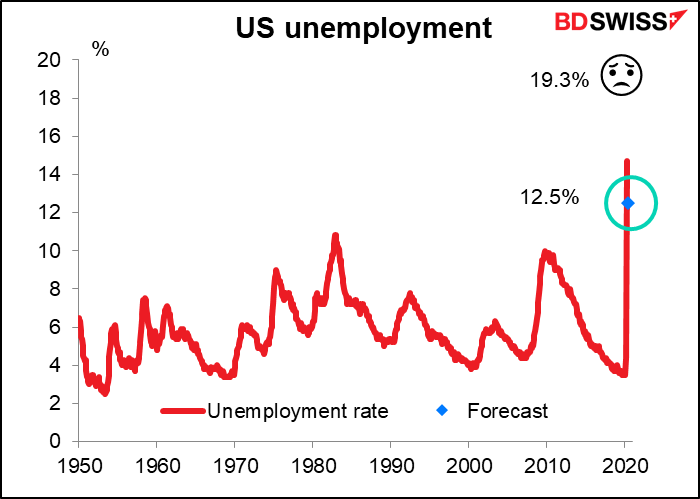
The terrible news though is that that still leaves some 21m people claiming unemployment benefits. Adding in other programs, there were 30.55mn people total claiming benefits, a 24x increase from the like year-earlier period (1.29mn). That would be an unemployment rate of 19.3%, far more than the official unemployment rate of 13.3%. That’s because of different definitions – you have to be actively looking for work to be counted as unemployed, but not to claim benefits. (This is just one more reason why people focus on the change in payrolls every month rather than the unemployment rate.)
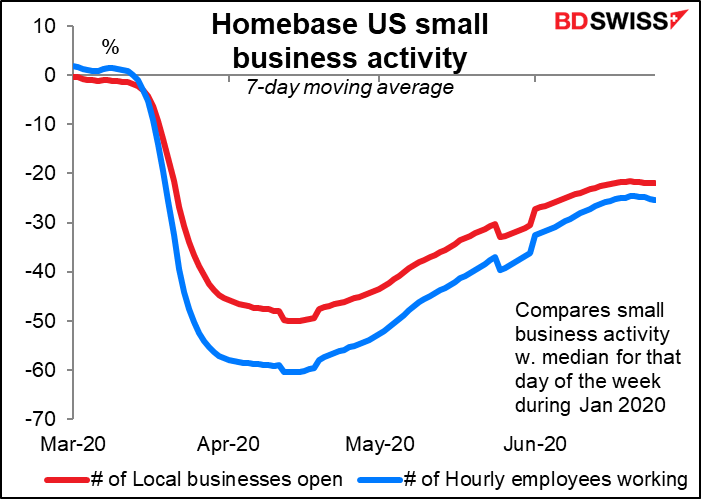
Furthermore, there are signs that the resumption of business is slowing or may even be peaking already. Homebase, a scheduling and time-tracking tool used by small businesses in the US, puts out a number of indices of small business activity. The indices compare activity each day with the median for that day of the week in January 2020. It appears that the number of business that are open has levelled off and the number of employees working has already started to turn down.
This agrees with the data from Open Table, a restaurant booking app, which shows that bookings from the US have dropped back again after a brief surge.
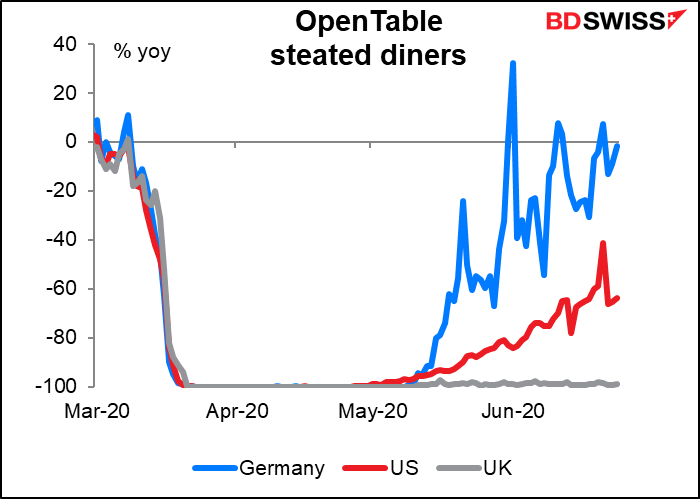
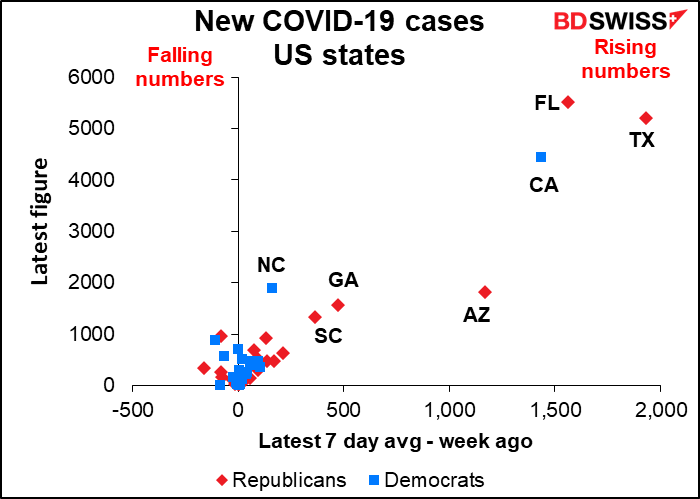
This is only to be expected as the number of virus cases explodes in some states, Florida, Texas and California particularly. Overall 36 out of 52 states & territories are seeing higher numbers than a week ago, while only 16 are showing declines.
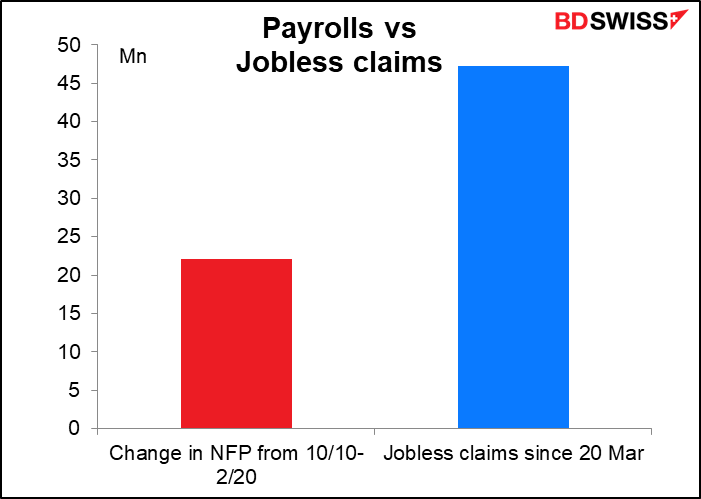
The plateau in small business activity confirms what central bankers around the world have been saying: it will take a long time to get back to pre-virus levels of employment. The number of jobless claims is already more than double the number of jobs that were created during the 10-year uninterrupted boom from 2010-2020.
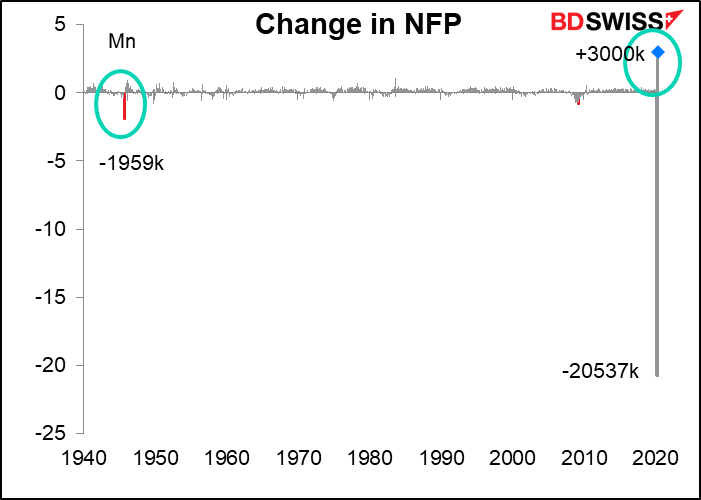
Next week’s nonfarm payrolls is forecast to be a record +3000k, topping last month’s 2509k, which is the record so far. Estimates range greatly, from 1000k to 5755k.
The unemployment rate is expected to fall back to 12.5%. Of course as noted above, it’s probably closer to 19.3% if we were to define unemployment the way most people would define it.
There’s little interest in the other data, such as average hourly earnings, which used to be quite important. Nowadays the only question is how quickly people are likely to get back to work.
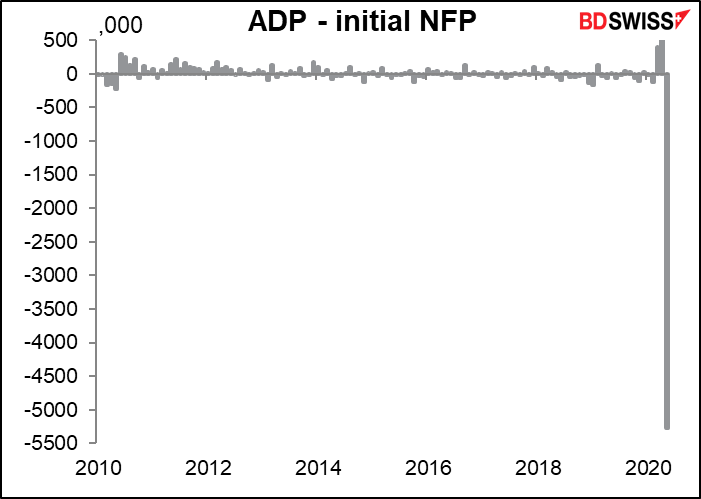
Wednesday’s monthly estimate by Automated Data Processing Inc. (ADP) is expected to be in line with the NFP this week at +3000k as well. Last month there was a shocking divergence between the two: the ADP figure was a record fall of -2760 while the NFP was a record rise of 2509k. This was a 54-standard-deviation figure, which I believe mathematics suggests one would see only every few billion years.
That’s actually it for the major US indicators out during the week. The other notable US event is that US Fed Chair Powell and Treasury Secretary Mnuchin appear before the House Financial Services Committee on Tuesday. They’ll be talking about the response to the virus. My guess: I think they’ll say they’ve been doing a good job and are ready to do even more if necessary. I just hope the Committee grills Mnuchin on the fact that the Treasury refuses to divulge who’s getting all that money. My guess is that a lot of it is going to a certain hotel in Palm Beach, Florida.
Because of the Fourth of July holiday, the Commitments of Traders report will be released on the following Monday instead of Friday.
This being the end of the month and the end of the quarter, there are a number of Japanese indicators out during the week.
On Tuesday, the last day of the month, we get the usual end-month data dump from Japan, including unemployment rate, job-offers-to-applicants ratio, and industrial production.
The unemployment rate is expected to rise only a little to a still-astonishing 2.8% — lower even than the US unemployment rate at its recent low – while the job-offers-to-applicants ratio is expected to fall to a still-health 1.22, meaning there’s still more than one job offer for every unemployed person.
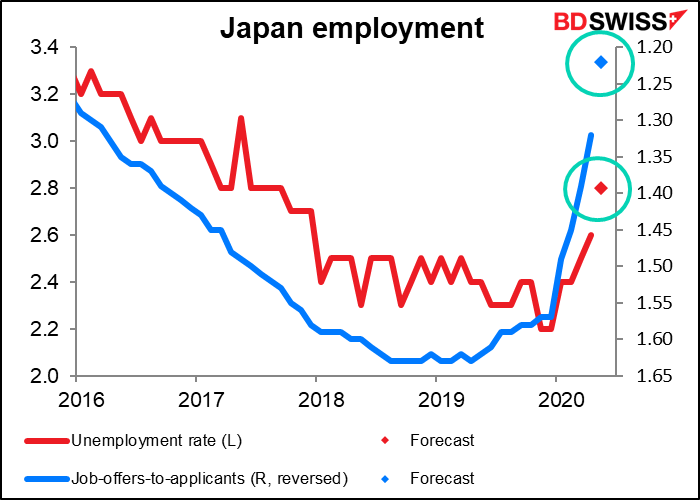
The figures don’t tell the whole story, however. There are also around 4.2mn people who are technically still employed but aren’t actually working. They may not be getting full salaries, if indeed they get anything. Adding these people in would give an unemployment rate of 11.5%. Then there’s another 940k people who left the labor force in April and are therefore no longer counted as unemployed. In other words, the Japanese are cooking the books even more than most other countries when it comes to unemployment and we can’t judge the situation from the headline statistics.
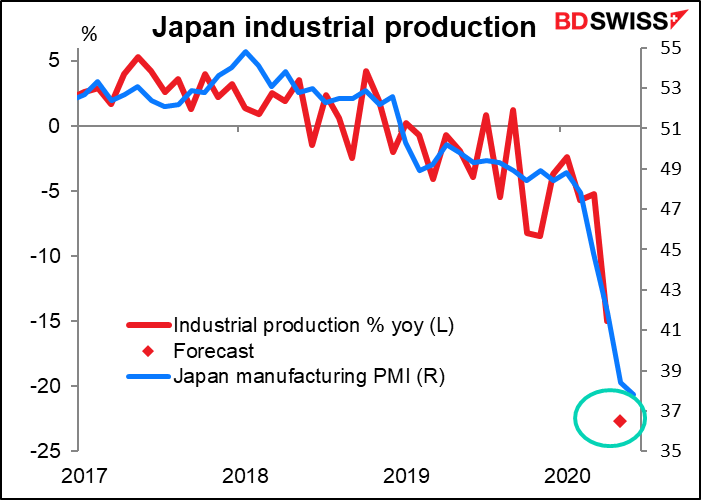
Unlike most countries, Japan’s industrial production is expected to have fallen further in May. This would be consistent with the Japan manufacturing purchasing managers’ index (PMI), which was the only one of the major industrial economies’ PMIs to fall during the month
The on Wednesday, the Bank of Japan releases its short-term survey of economic conditions, universally known by its Japanese acronym, the Tankan.
The market expects a sharp drop in the diffusion indices for Q1, especially in services, which are expected to drop into negative territory from positive. But they’re not expected to be as bad as hey were back in 2008/09, and furthermore they’re forecast to rise a little in Q3. This is surprising, considering how far the purchasing managers’ indices fell. I think a result like this could give the yen a boost.

Investors are also likely to pay attention to the weekly data on Japan purchases of foreign stocks and bonds. Over the last three weeks, Japanese investors have bought an unusually high JPY 4.3tn of foreign bonds to take advantage of the sell-off in foreign markets. This is probably what has kept JPY within a relatively narrow range recently.

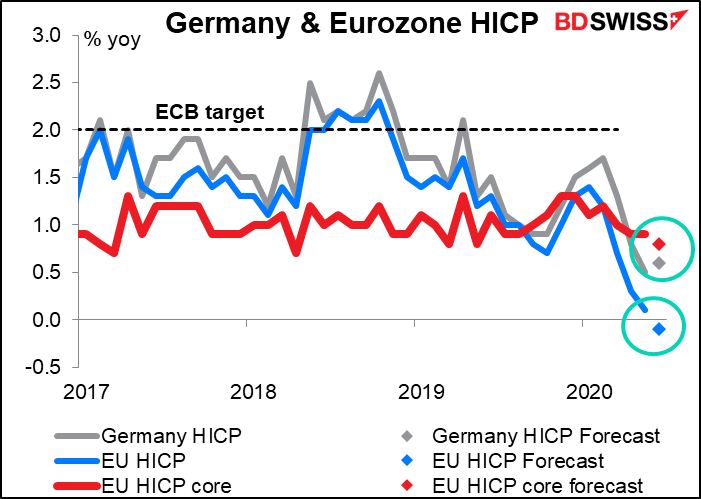
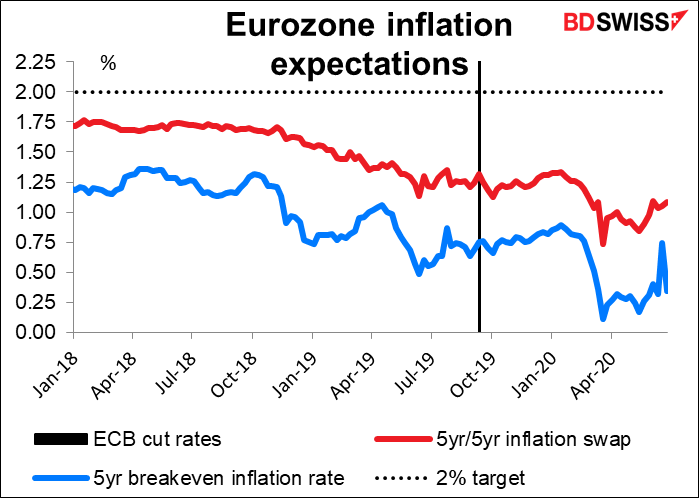
Elsewhere, we get the EU inflation data – Germany on Monday and the EU-wide data on Tuesday. German consumer price inflation is expected to tic up one tic, but the headline EU figure is expected to flip over into slight deflation, while the core CPI is forecast to tic down one tic. Overall not much change but that negative number for the headline would probably raise some eyebrows in Frankfurt.
What’s even more frightening for the European Central Bank (ECB) is probably the fall in inflation expectations. The 5yr/5yr inflation swap – the ECB’s favorite gauge of inflation expectations, the expected inflation rate for five years starting five years from now – is down to 1.05%, or about half the ECB’s 2% target. That means the market doesn’t even expect them to hit their target five years from now and probably not in 10. A serious vote of no-confidence.
Author

Marshall Gittler
Trading Analysis


