Weekly Market Brief: DXY and US10 are very extended to the upside

A week of strong declines that saw the main indices reach the lows of June 2022.
The strong downward extension suggests a short-term recovery: looking at specific indicators such as S5FI we are now in an area of extreme oversold.
DXY and US10 are very extended to the upside and their possible retracement could give the markets upside momentum.
|
Financial index |
Current price* |
Forecast |
S1 |
R1 |
S2 |
R2 |
|---|---|---|---|---|---|---|
|
FTSE100 |
7,018 |
Cons./ Bullish |
7,000 |
7,500 |
6,850 |
7,630 |
|
FTSEMIB |
21,066 |
Cons./ Bullish |
20,700 |
23,650 |
20,000 |
25,000 |
|
DAX40 |
12,284 |
Cons./ Bullish |
12,200 |
13,600 |
11,500 |
14,000 |
|
S&P 500 |
3,693 |
Cons./ Bullish |
3,645 |
4,100 |
3,500 |
4,300 |
|
NASDAQ 100 |
11,311 |
Cons./ Bullish |
11,150 |
12,800 |
10,710 |
13,600 |
|
DOW JONES |
29,590 |
Cons./ Bullish |
29,170 |
32,000 |
28,150 |
33,250 |
|
TADAWUL |
11,462 |
Cons./ Bullish |
11,250 |
12,270 |
10,900 |
12,650 |
|
FTSE ADX |
10,025 |
Consolidation |
9,615 |
10,200 |
9,160 |
10,500 |
|
DFM |
3,408 |
Consolidation |
3,270 |
3,500 |
3,100 |
3,730 |
|
Indicator |
Current price |
Forecast |
S1 |
R1 |
S2 |
R2 |
|---|---|---|---|---|---|---|
|
VIX index |
29.91 |
Cons./ Bearish |
20.00 |
35.00 |
11.00 |
41.00 |
|
US dollar index (DXY) |
113.023 |
Cons./ Bearish |
105.00 |
110.50 |
103.00 |
114.00 |
|
US10 years yield |
3.691% |
Cons./ Bearish |
2.900% |
3.500% |
2.500% |
3.650% |
|
S5FI* |
4.37 |
Cons./ Bullish |
40 |
80 |
30 |
90 |
Following the strong selling pressure that have just occurred, we believe it is appropriate to evaluate long positions: the strong bearish extension certainly does not exclude further declines, but we believe that the risk /reward is now very unbalanced and in favour of short-medium term rises.
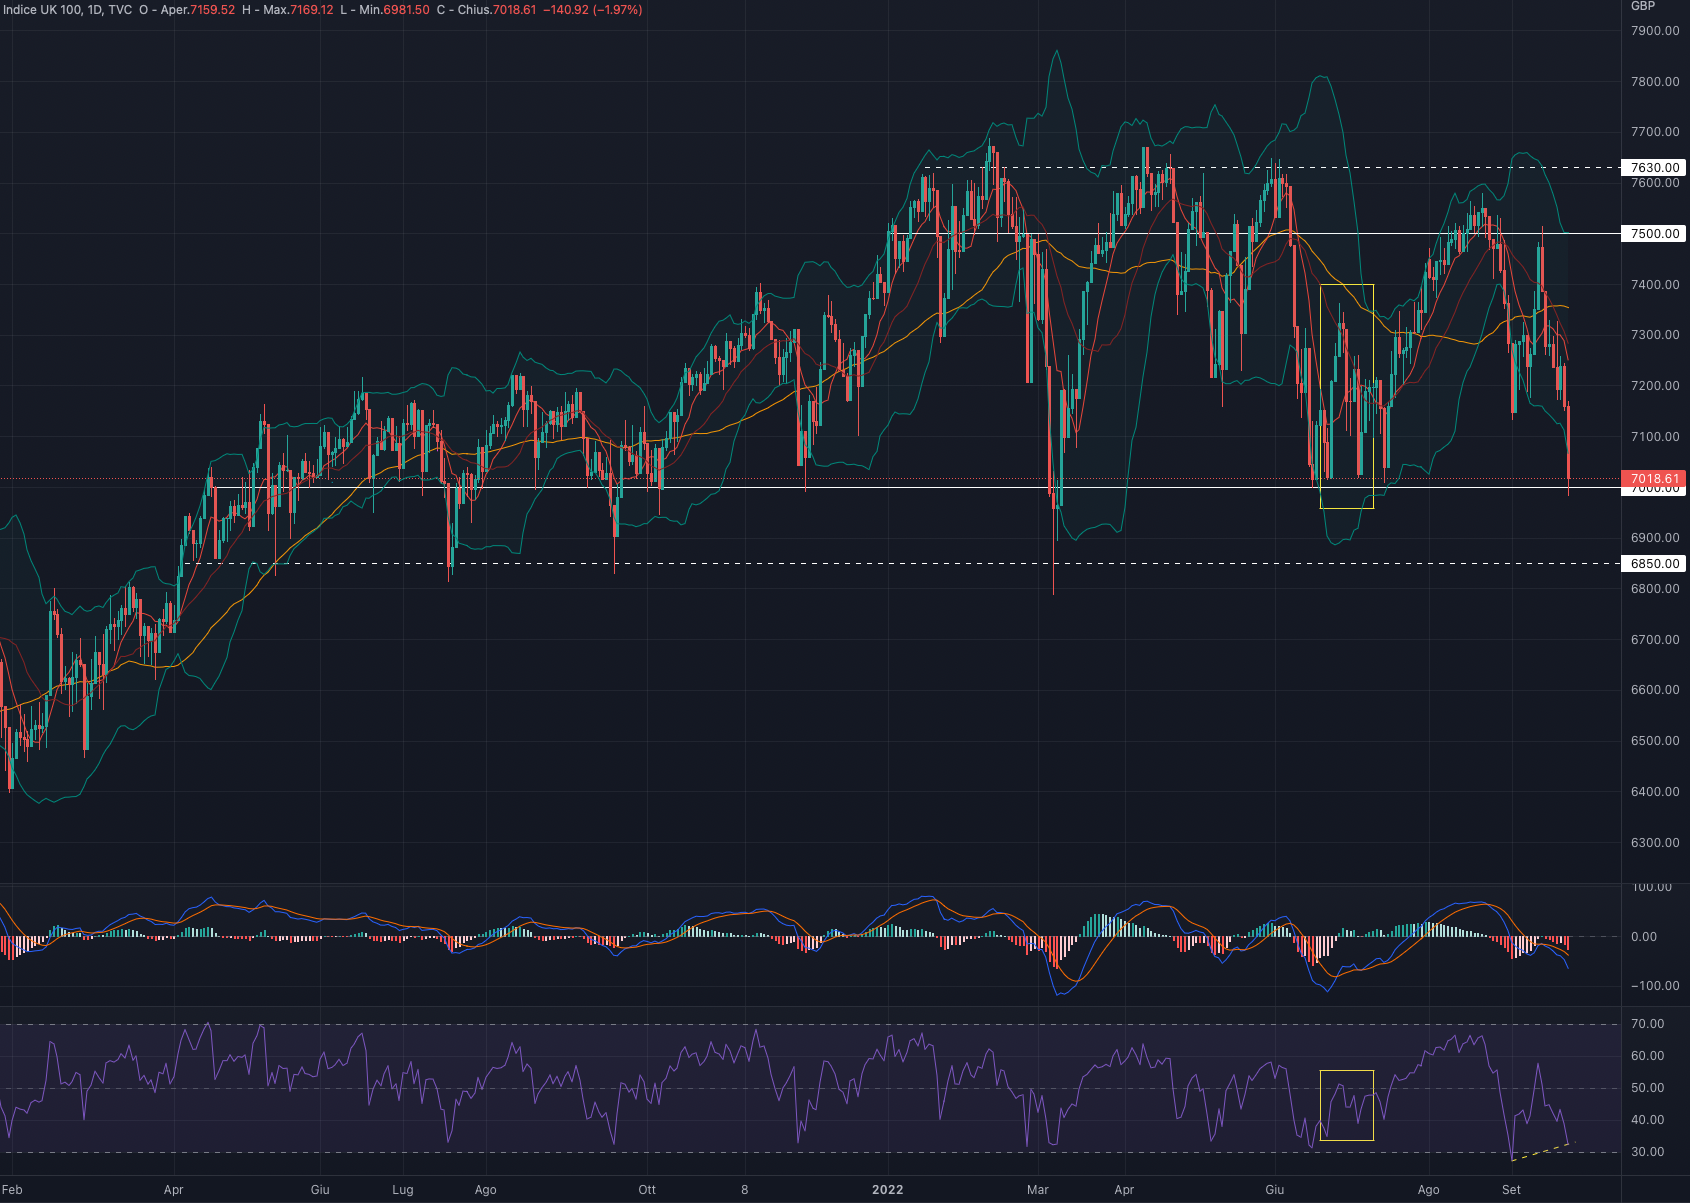
FTSE 100 (UKX)
The FTSE100 index had a week down by - 3.01%.
For the week ahead, we are in favour of a recovery to at least 7,150.
Indicators
Week of significant declines for the British index which now sees the price testing again the 7,000 level.
The exit from the Bollinger bands and the marked distance from the 50MA (yellow line) makes us lean towards a recovery of vigour for the end of September.
MACD and RSI are both very extended to the downside and looking at previous swings it is desirable to expect a recovery. On the RSI it is important to note a positive divergence with the minimum reached in September.
|
Current price |
Forecast |
S1 |
R1 |
S2 |
R2 |
|---|---|---|---|---|---|
|
7,018 |
Cons./ Bullish |
7,000 |
7,500 |
6,850 |
7,630 |
A price recovery could see its first target at the breaking point at 7.150 followed by a continuation up to 7.320.
We are positive on the FTSE100, expecting a sizeable rebound after the most recent declines
Support at 7,000.
Resistance at 7,500.
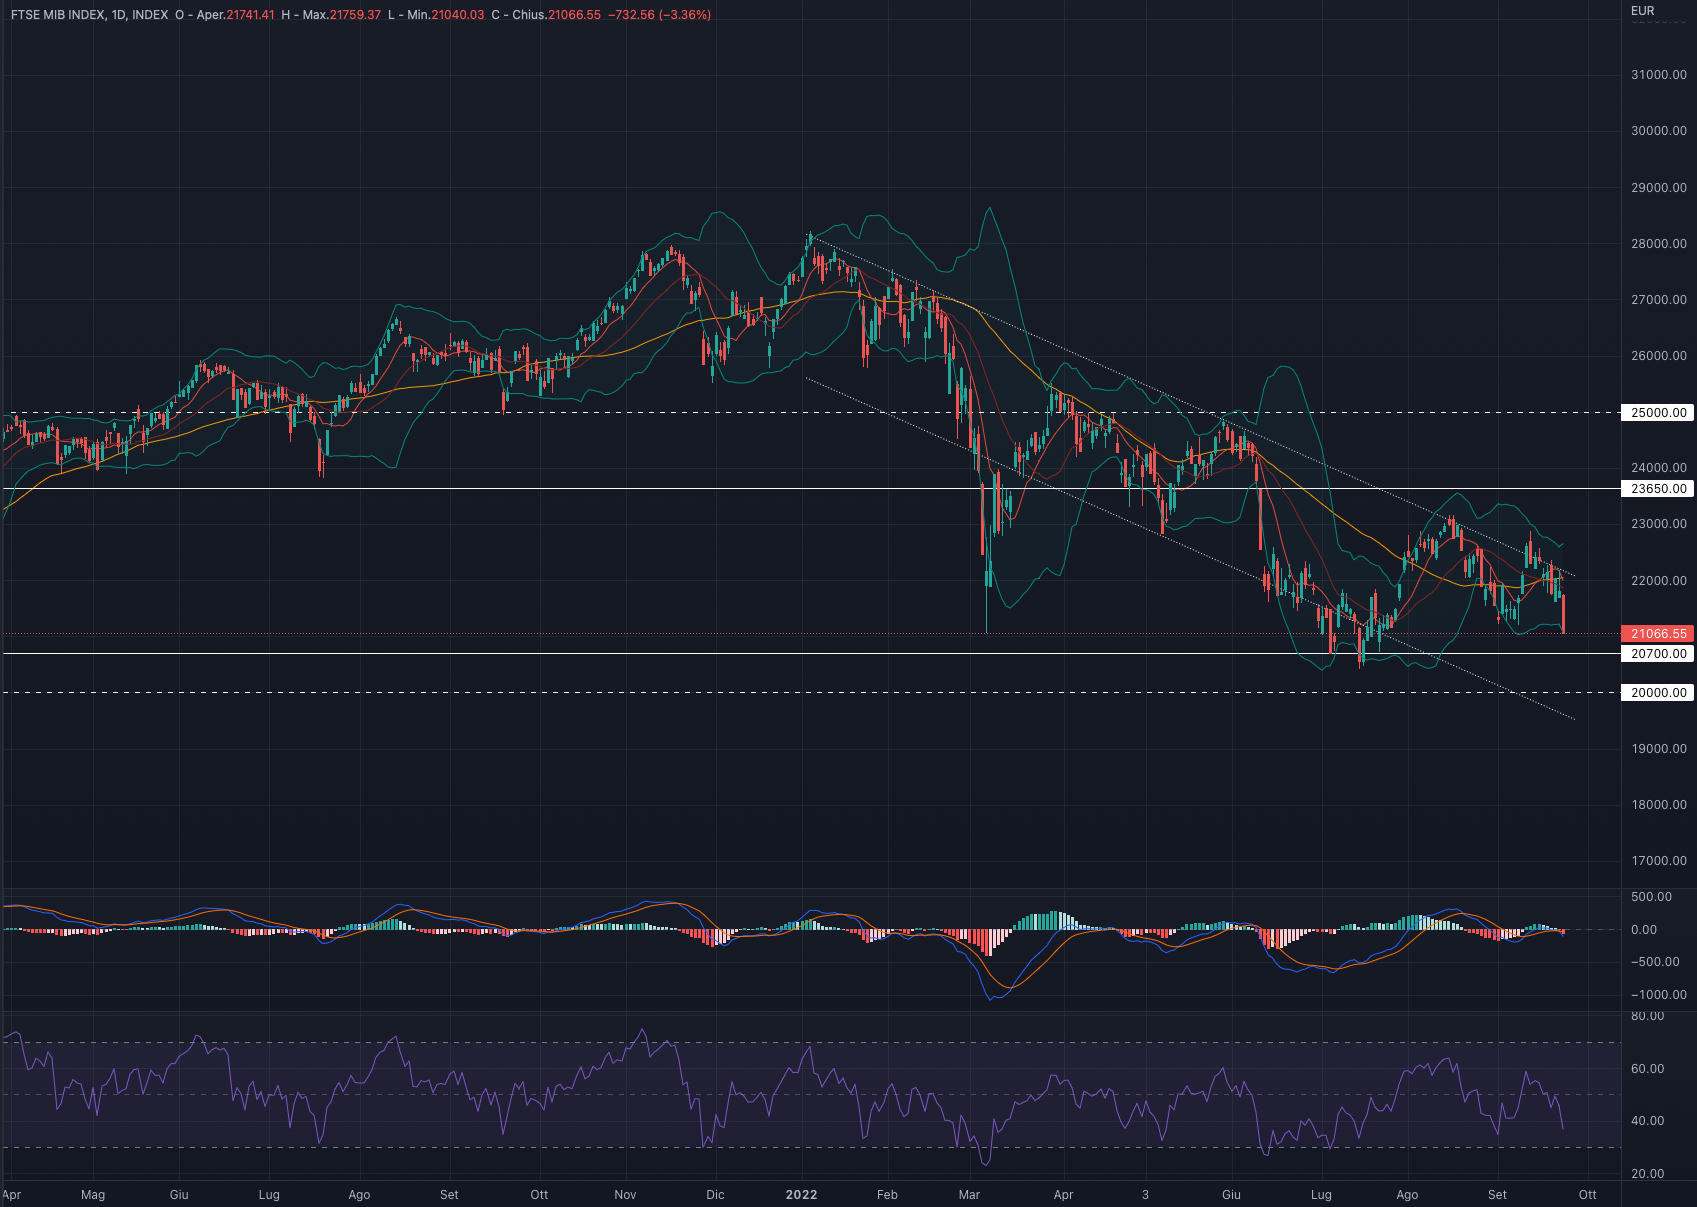
FTSEMIB (FTSEMIB)
The FTSEMIB index had a week down by -4.72%
For the week ahead, we are in favour of a recovery to at least 21,700
Indicators
The moves on Friday broke the short phase of rising lows that began in July 2022 and bring the index back into a substantial phase of consolidation.
MACD and RSI are in bearish territory, especially the latter by being close to the oversold area.
While we believe that the recovery that took place in July is very positive in the medium term, we believe it is appropriate to wait for a price confirmation.
Given the importance of Friday's candle, we believe it is appropriate to remain neutral on the FTSEMIB. The price is certainly interesting but it needs confirmation before considering long setups.
|
Current price |
Forecast |
S1 |
R1 |
S2 |
R2 |
|---|---|---|---|---|---|
|
21,066 |
Cons./ Bullish |
20,700 |
23,650 |
20,000 |
25,000 |
Support at 21,500.
Resistance at 23,650.
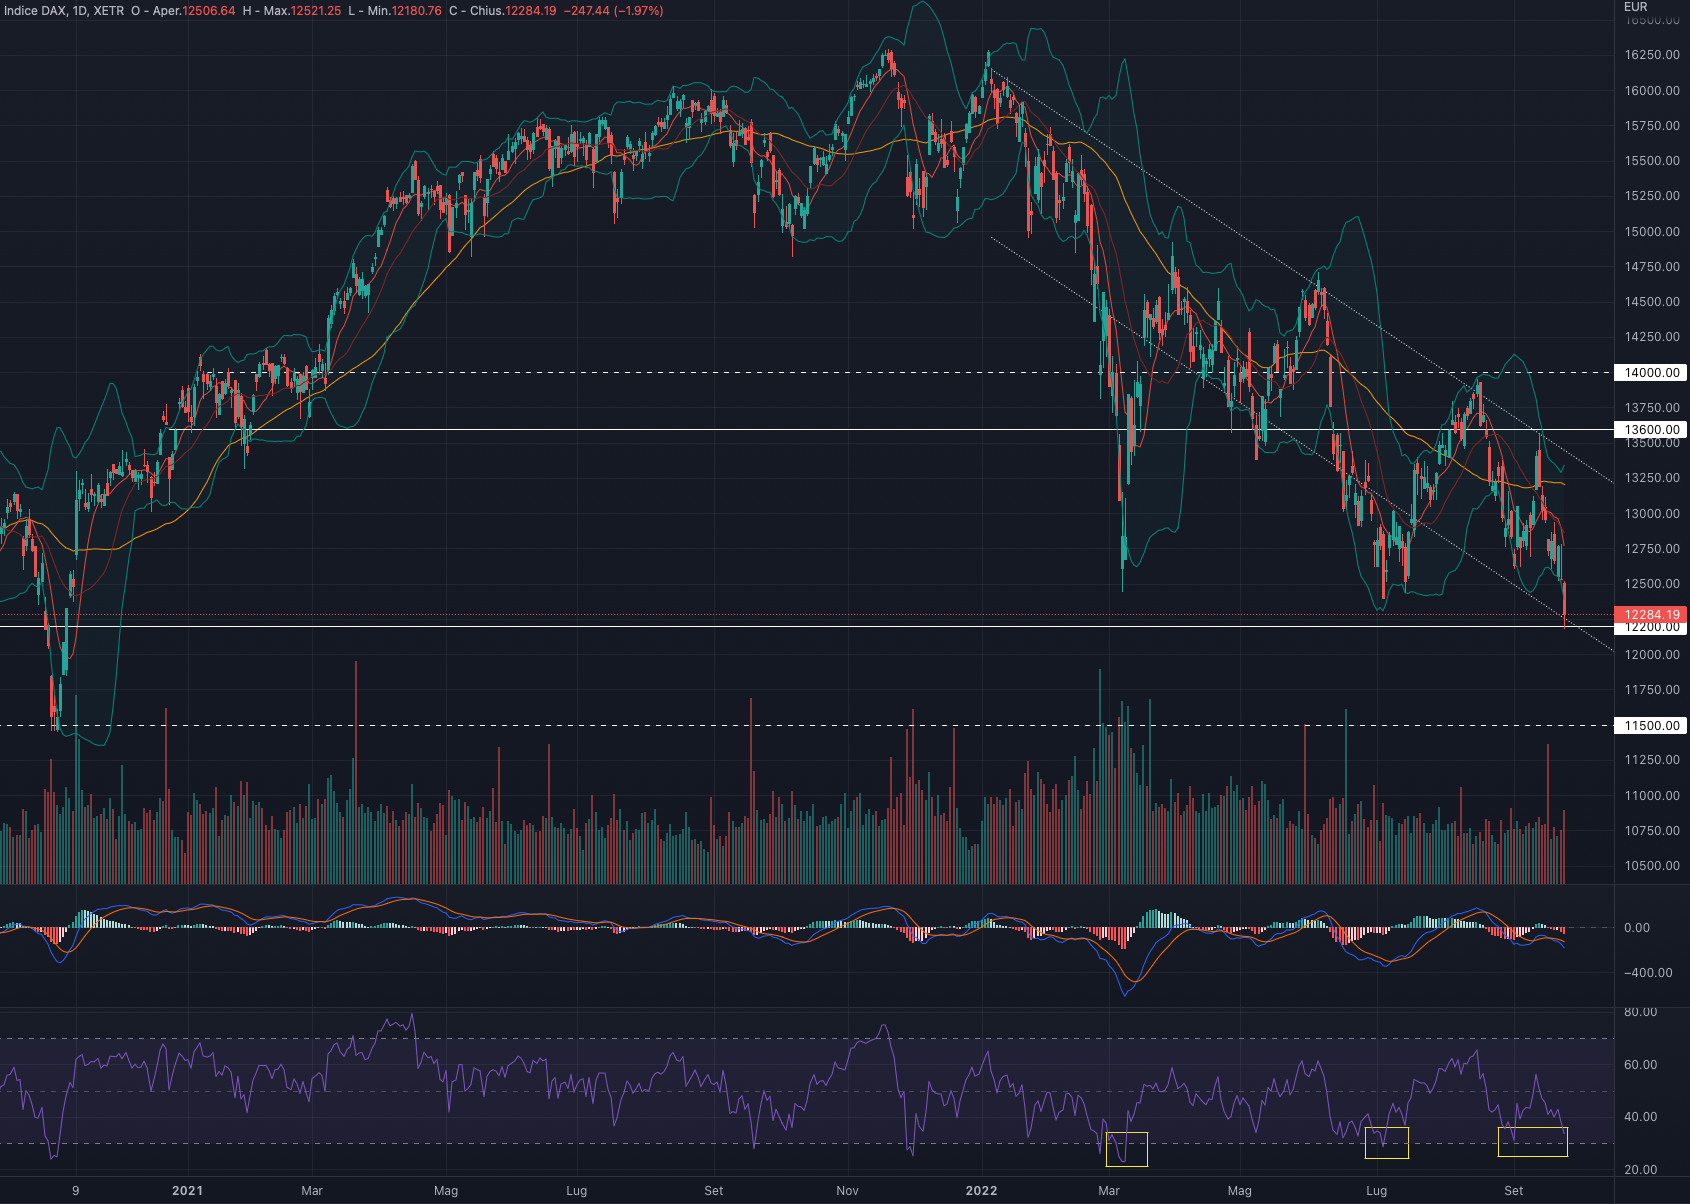
DAX 40 (DAX)
The DAX index had a week down by -3.59%.
For the coming week we are in favour of a possible recovery to at least 12,800.
Indicators
Week that sees once again respecting the strong bearish trend line that started in January 2022.
The price is now near the strong support at 12.600 which we believe will once again play the role of a reversal area.
|
Current price |
Forecast |
S1 |
R1 |
S2 |
R2 |
|---|---|---|---|---|---|
|
12,284 |
Cons./ Bullish |
12,200 |
13,600 |
11,500 |
14,000 |
MACD and RSI are both negative but we can see a positive divergence with the price action when this reached the support at 12.600.
We are currently still neutral on the DAX and in the process of considering long setups once we break above 13,250
Support at 12,600.
Resistance at 13,600.
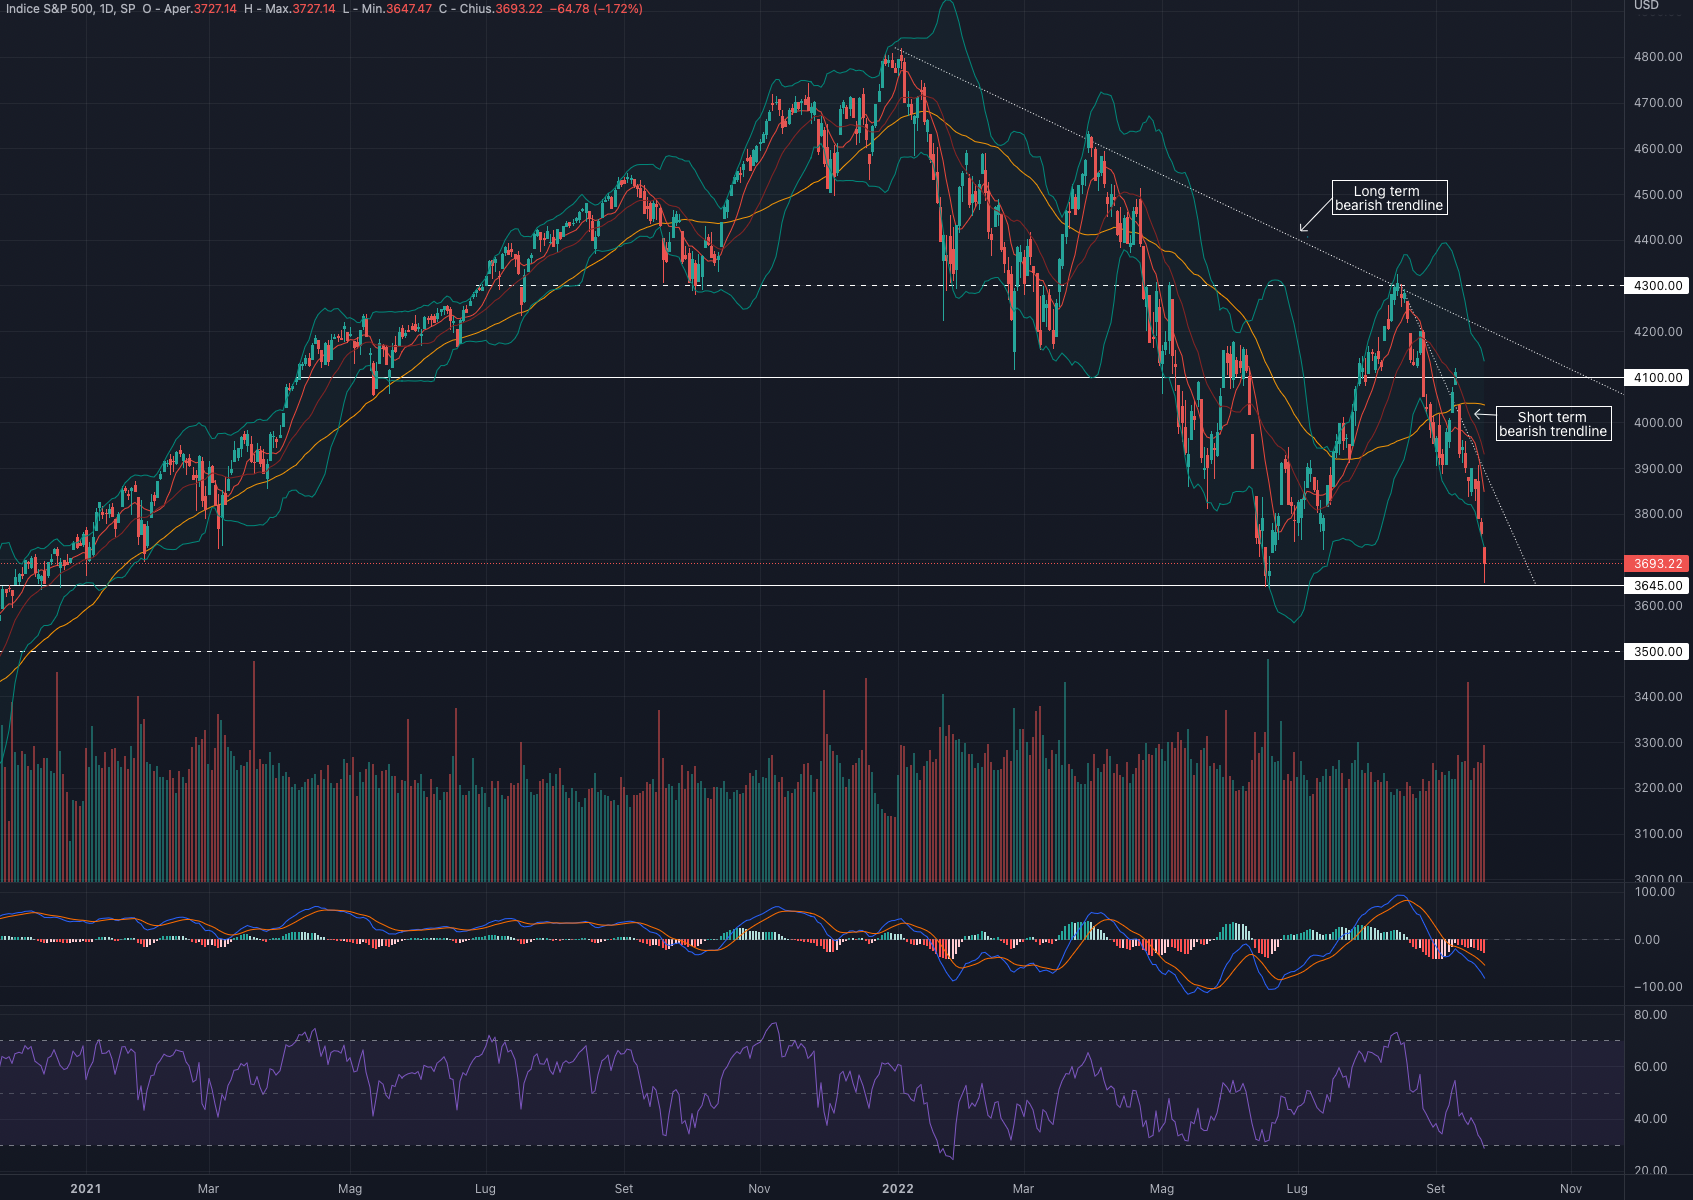
S&P 500 (SPX)
The S&P500 index had a week down by -4.70%.
For the week ahead, we are in favour of a possible recovery to at least 3,800-3,900.
Indicators
Week that saw the index overcoming the strong support at 3,830 and now near the lows reached in June.
MACD and RSI perfectly describe the bearish period of the index with the first below 0 and the second now in the oversold area.
To understand when the price can begin the long-awaited upward recovery, we believe it is appropriate to rely on the breakdown of the bearish trendlines present on the index: the first we identify starting from August 16 (short term) and the second starting from January 2022 ( long period).
|
Current price |
Forecast |
S1 |
R1 |
S2 |
R2 |
|---|---|---|---|---|---|
|
3,693 |
Cons./ Bullish |
3,645 |
4,100 |
3,500 |
4,300 |
At the moment we remain neutral on the S&P500 and ready to consider long setups at the break of the short-term bearish trendline, which could come with a consolidation above 3,800. The current level is very interesting but requires price confirmations before considering a long positioning.
Support at 3,645.
Resistance at 4,100.
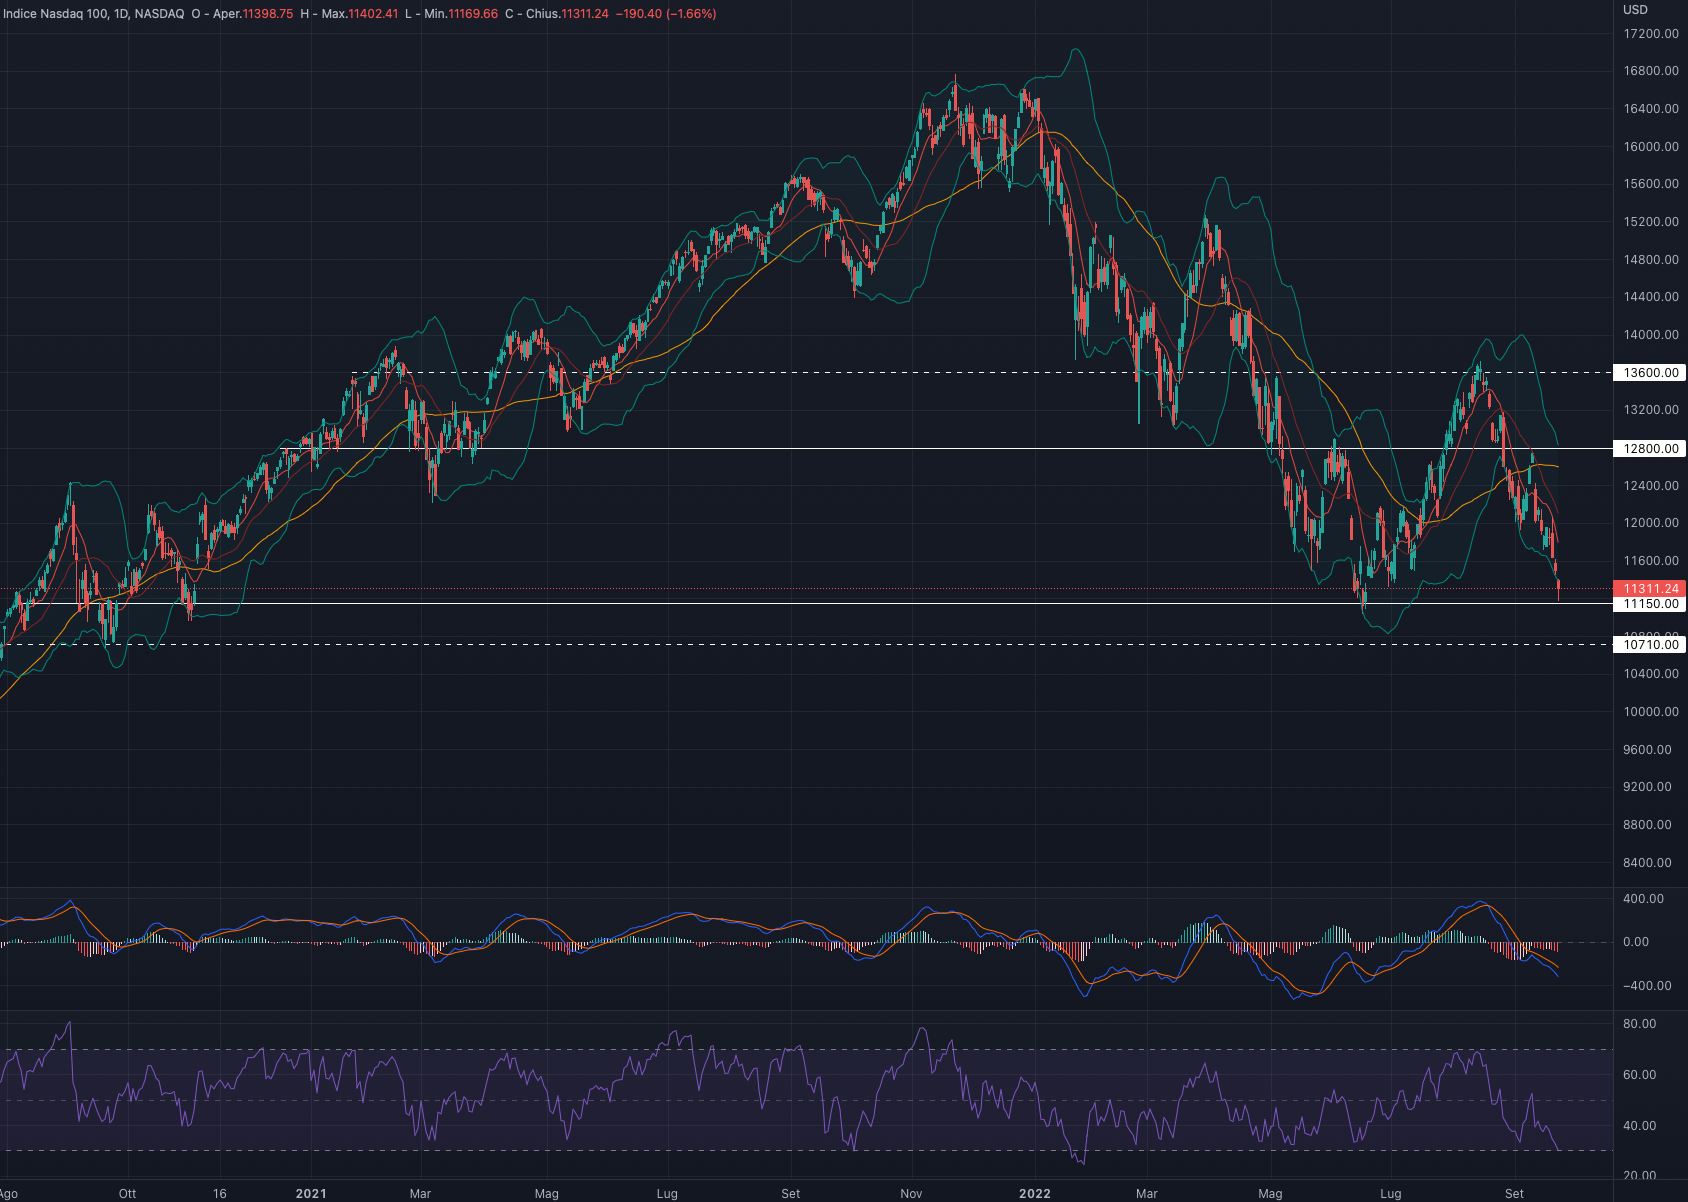
NASDAQ 100 (NDX)
The NASDAQ 100 index had a week down by -4.64%.
For the week ahead we are in favour of a possible recovery to at least 11,800-12,000.
Indicators
Week that now sees the Tech index moving in the area tested in June 2022.
The steep declines have now taken the price out of the Bollinger bands and distant from the 9 (red line) and 50 (yellow line) MA. Looking at past price action, it is possibile to expect a bullish recovery at least up to 12,250-12,500 in the short-medium term.
|
Current price |
Forecast |
S1 |
R1 |
S2 |
R2 |
|---|---|---|---|---|---|
|
11,311 |
Cons./ Bullish |
11,150 |
12,800 |
10,710 |
13,600 |
MACD and RSI well describe the period of strong bearish extension by being, especially the RSI, in oversold territory.
Given the strong downward extension of both price and indicators, we are slightly positive on the NASDAQ believing that risk / return is now heavily skewed in favour of short to medium term upside.
We will have further confirmation only from the overcoming of the 9 and 50 moving average.
Support at 11,700.
Resistance at 13,500.
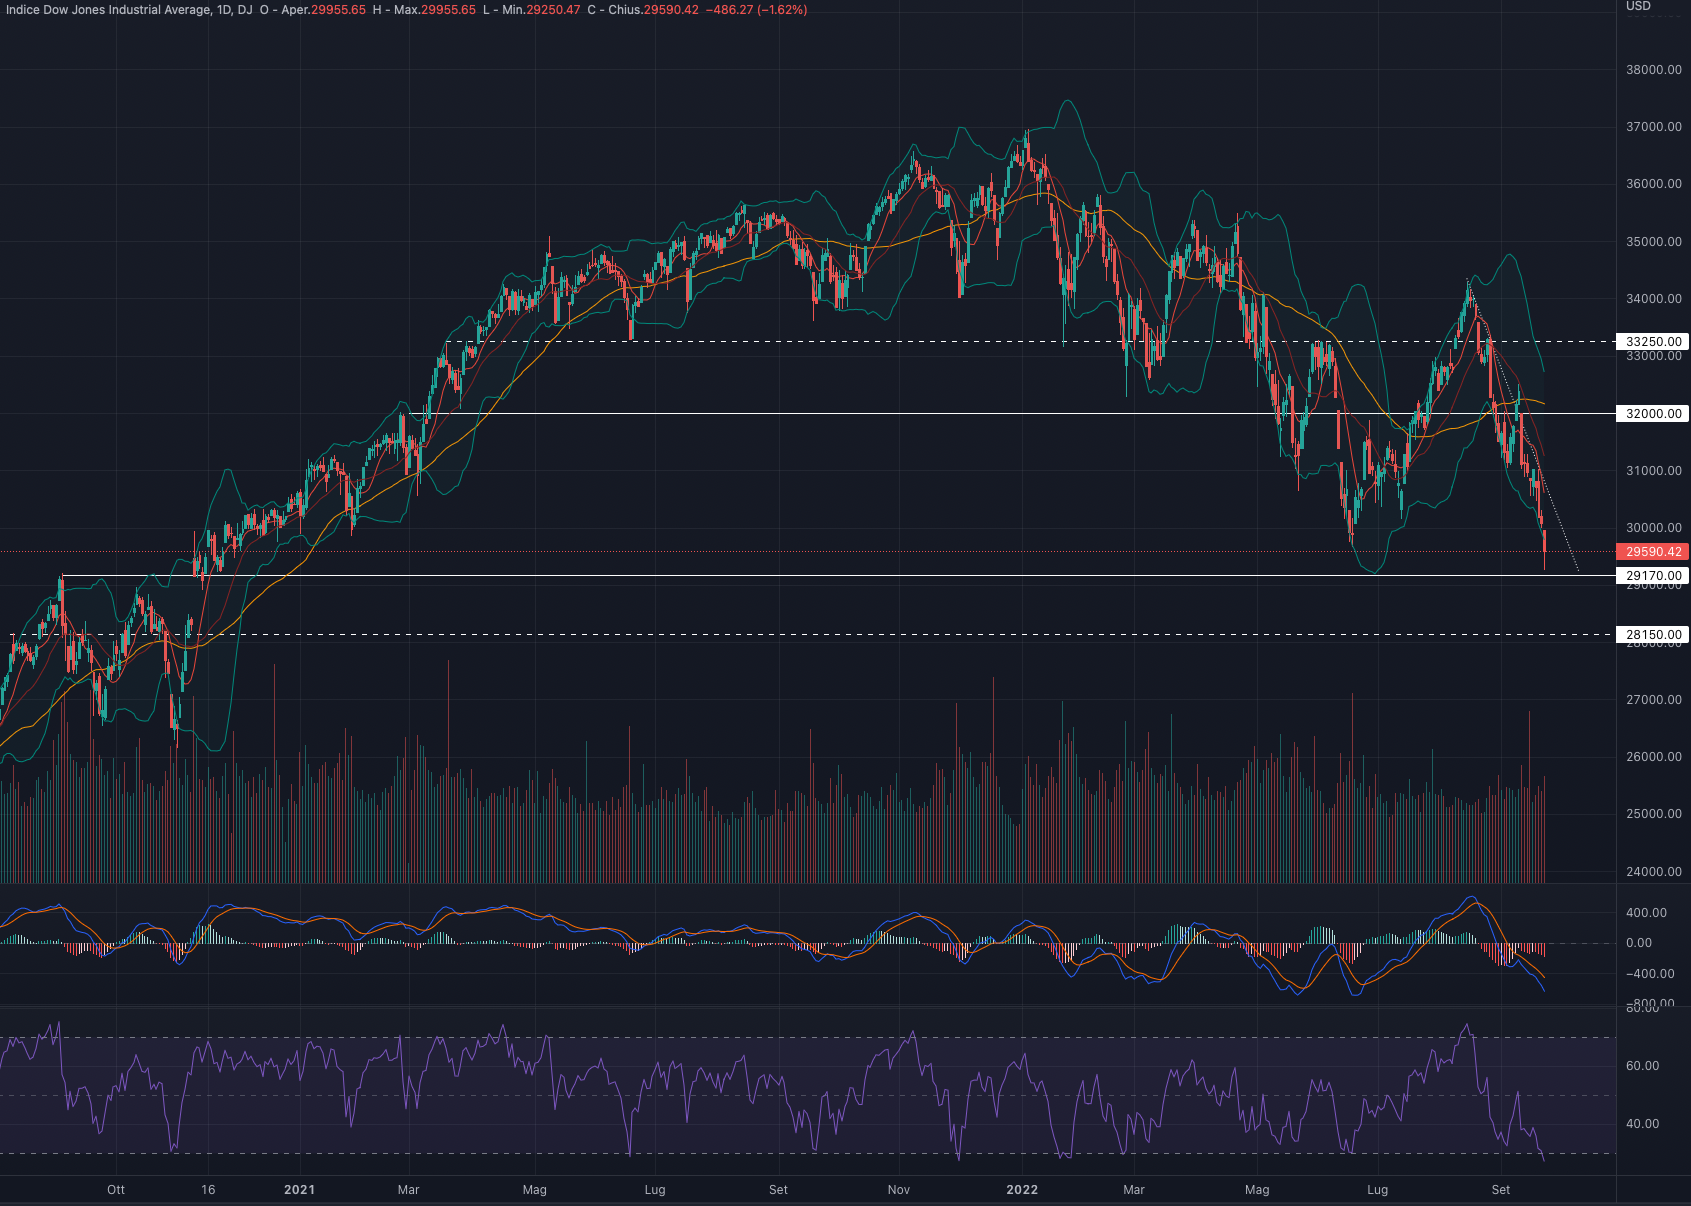
Dow Jones (DJI)
The DOW JONES index had a week down by -4.00%.
For the coming week we are in favour of a possible recovery to at least 31,500.
Indicators
Week that brings the American index back to the lows of June 2022. After the strong Friday's selling pressure, the price is now outside the Bollinger bands and with a considerable distance from the main moving averages at 9 (red line) and 50 (yellow line ) days.
MACD and RSI are aligned with the price action, also being very extensive on the downside. In particular, the RSI is now in oversold territory.
|
Current price |
Forecast |
S1 |
R1 |
S2 |
R2 |
|---|---|---|---|---|---|
|
29,590 |
Cons./ Bullish |
29,170 |
32,000 |
28,150 |
33,250 |
Given the strong downward extension of indicators and prices, we believe that the risk/return is now skewed in favour of short-medium term rises: we are positive on the DOW JONES expecting a possible recovery of vigour which sees the strong level of 32,000 as a target of short term and intermediate resistance.
Support at 29,170.
Resistance at 32,000.
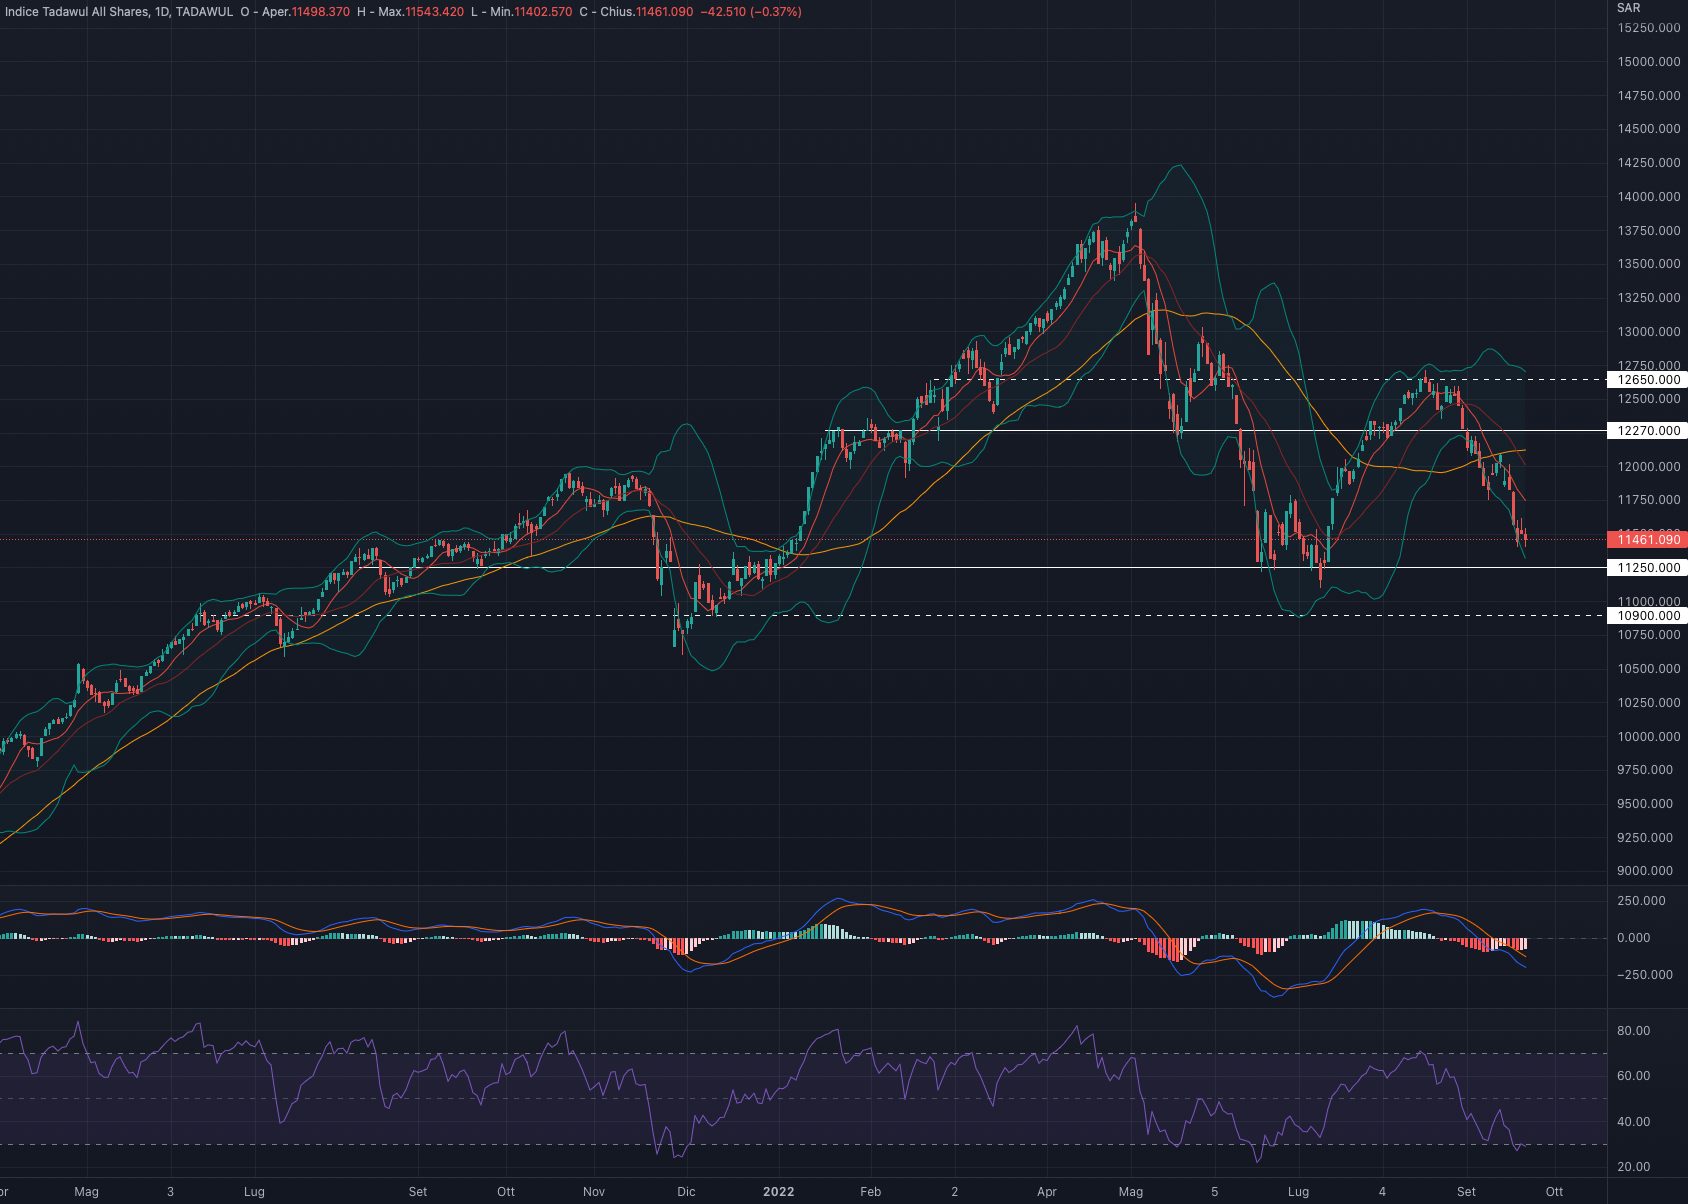
TADAWUL (TASI)
The TADAWUL index had a week down by -3.11%.
For the coming week we are in favour of a consolidation in the area of SAR 11,400 - 11,800.
Indicators
Week that saw the Saudi index hit the strong support area at SAR 12,500. Based now on past action, it is desirable to expect a possible consolidation before an upward recovery.
MACD and RSI correctly describe the strong bearish extension of the index with the former in marked negative territory and the RSI oversold.
|
Current price |
Forecast |
S1 |
R1 |
S2 |
R2 |
|---|---|---|---|---|---|
|
11,462 |
Cons./ Bullish |
11,250 |
12,270 |
10,900 |
12,650 |
The extremes reached by the internal indicators, combined with the presence of the strong support area, make us lean towards a short-term recovery that could be confirmed by the exceeding of SAR 11,700
At the moment we prefer to remain neutral on the Tadawul to understand if the price will be able to consolidate in the area of SAR 11,500 - 11,700: a similar scenario could in fact offer interesting long setups.
Support at 11,250.
Resistance at 12,270.
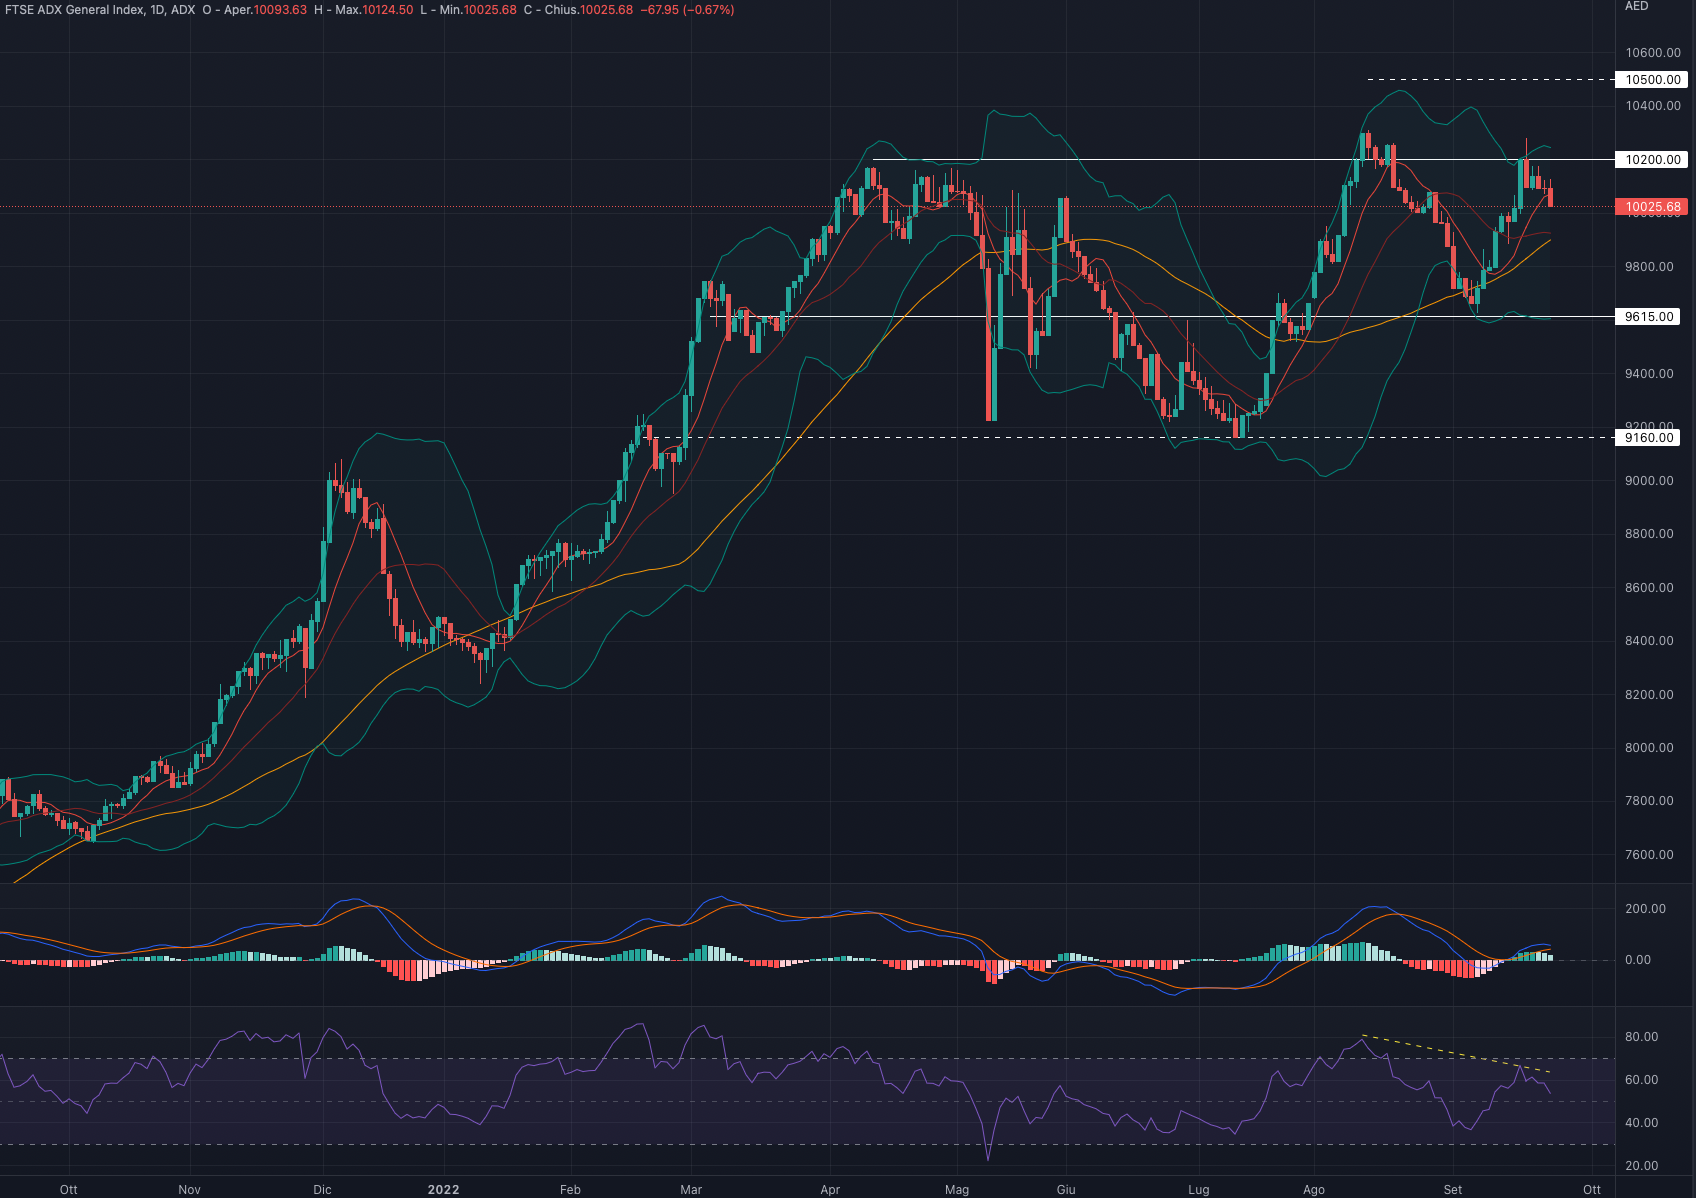
FTSE ADX GROWTH MARKET INDEX (FADGI)
The FTSE ADX index had a week down by -1.72%
For the coming week we are in favour of a consolidation in the area of AED 9,900 - 10,115
Indicators
Slightly bearish week that keeps the index near the strong resistance at AED 10,200
The trend reversal that took place on 7 September is very positive with a view to bullish continuation, at the same time we must not rule out a possible retracement after the most recent stretches.
MACD and RSI are positive and seem to support the advance of the index: the first has crossed the 0 line (bullish momentum) and the second is near the level of 60.
|
Current price |
Forecast |
S1 |
R1 |
S2 |
R2 |
|---|---|---|---|---|---|
|
10,025 |
Consolidation |
9,615 |
10,200 |
9,160 |
10,500 |
It is in particular the RSI that makes us remain cautious on the index: we can in fact note a negative divergence with the highs of mid-August 2022, which make us lean towards a loss of strength,
At the moment we prefer to remain neutral on the FTSE ADX: while the mere price action is very positive, we believe that some internal indicators may signal a possible short-term weakness.
Support at 9,615.
Resistance at 10,200.
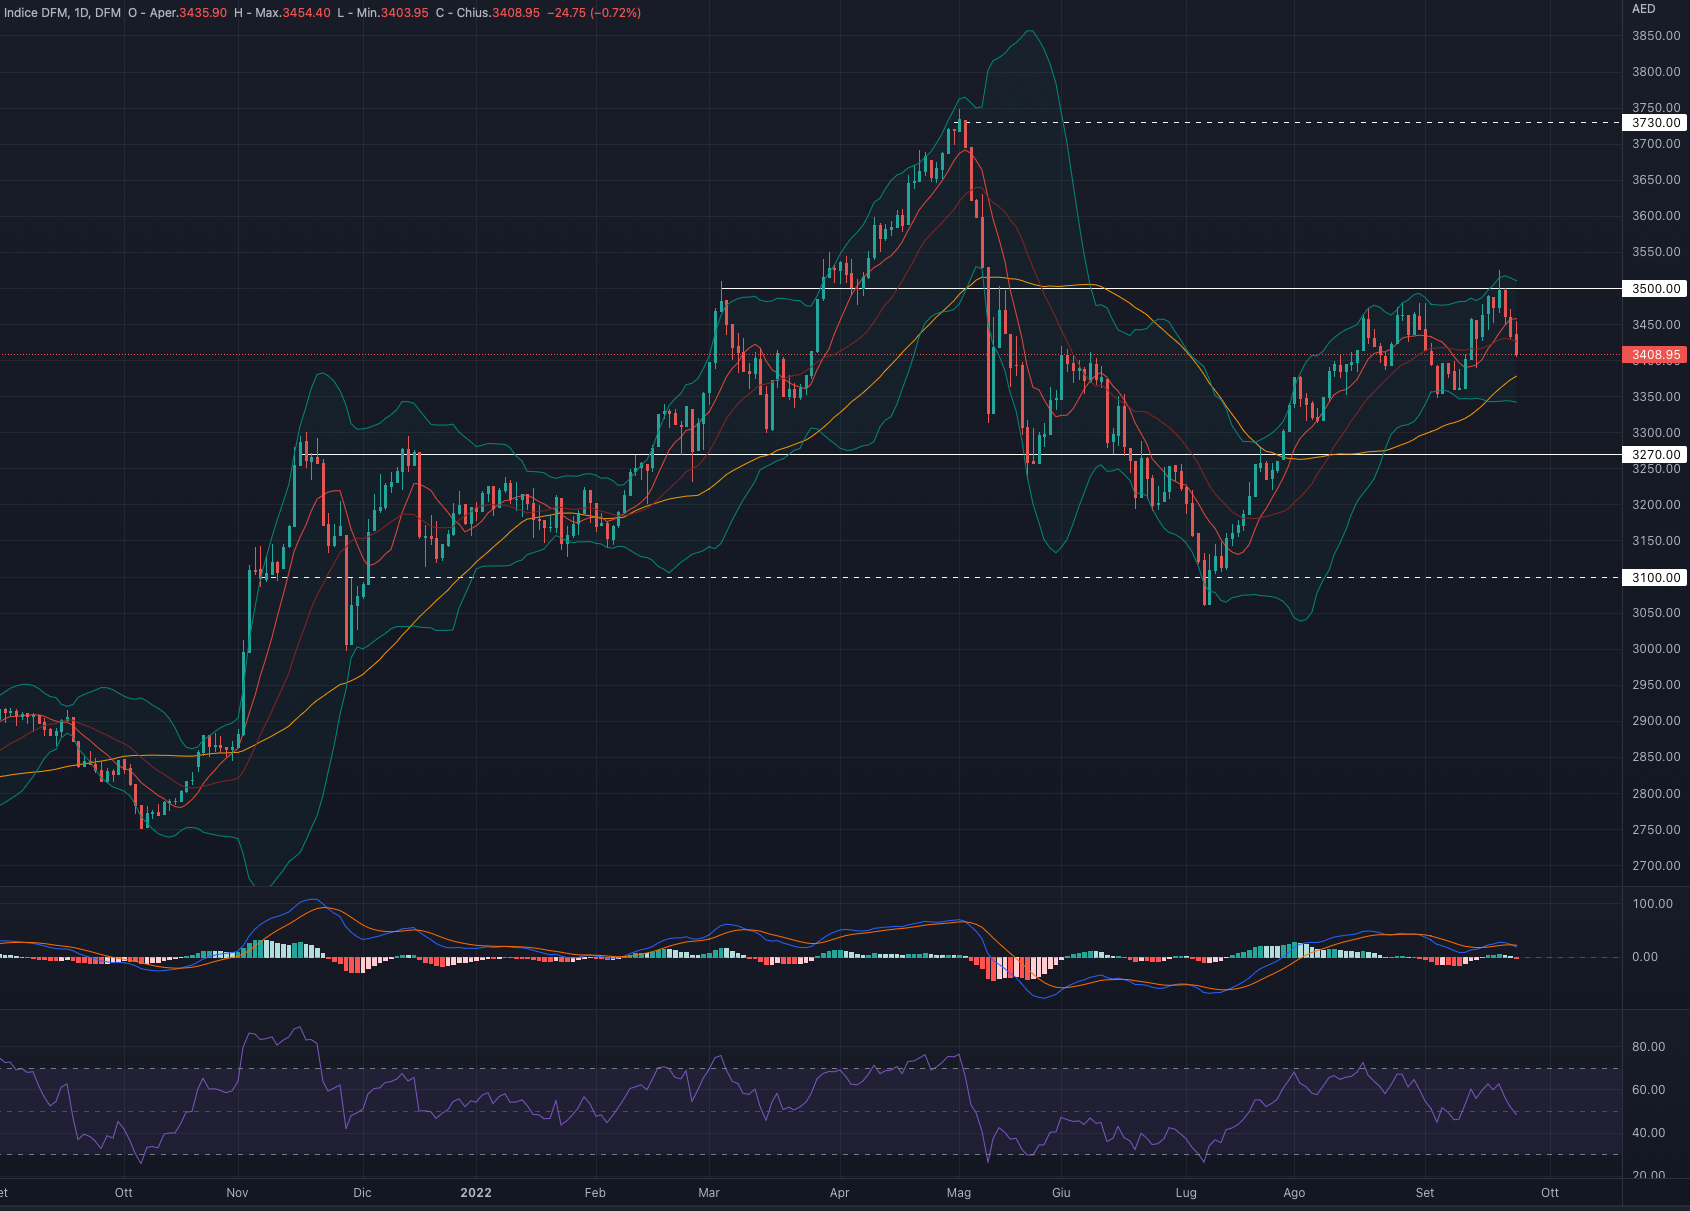
DUBAI FINANCIAL MARKET GENERAL INDEX (DFMGI)
The DFM index had a week down by -2.30%.
For the coming week we are in favour of a consolidation in the area of AED 3,350 - 3,400.
Indicators
A week that saw the index consolidate near the strong support at AED 3,500.
The fact that the price continues to remain above the 50-day average (yellow line) is certainly a very important aspect in the short-medium term.
MACD and RSI are positive but signal a negative divergence with the price starting from mid-August 2022. In this period, if on the one hand we witnessed an almost flat price, on the other we saw a gradual weakening of internal indicators.
|
Current price |
Forecast |
S1 |
R1 |
S2 |
R2 |
|---|---|---|---|---|---|
|
3,408 |
Consolidation |
3,270 |
3,500 |
10,900 |
12,650 |
Weakening which, in our view, could exclude for now a break to the upside of resistance at AED 3.475.
At the moment we prefer to remain neutral on the DFM: while the mere price action is very positive, we believe that some internal indicators may signal a possible short-term weakness.
Support at 3,270.
Resistance at 3,500.
Author

Francesco Bergamini
OTB Global Investments
Francesco, BSc Finance and Msc in Business Management, graduated with Merit, is a professional with experience in the financial services industry and a keen interest in the financial markets.


