Weekend Report Preview
The Dollar
The dollar is caught between the 50 day MA and the 200 day MA which is obscuring our cycle counts.
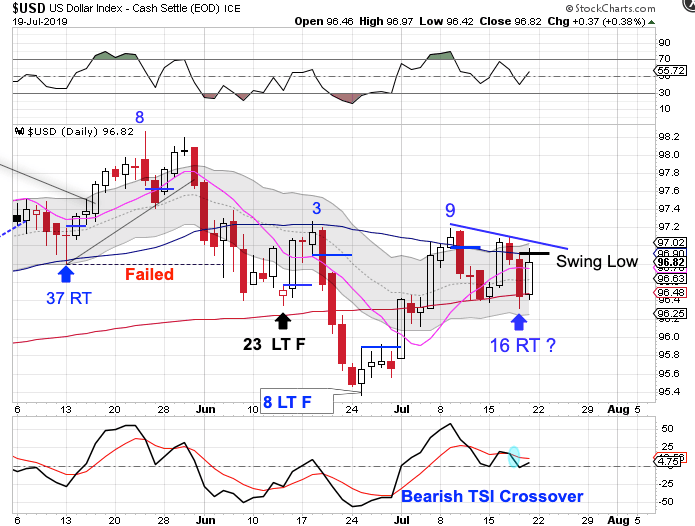
Day 9 remains as the daily cycle peak. A peak on day 9 can still result in a left translated daily cycle formation. A left translated daily cycle formation would align with the dollar being in an intermediate cycle decline.
The decline into the DCL has twice been halted by the 200 day MA. The dollar printed its lowest point on Thursday, day 16, which is early to expect a DCL. But with the manipulation of the currencies by central banks it is possible that Friday's swing low did form the DCL.
Our expectation is to see a left translated, failed daily cycle. But a break above the declining trend line would have us label day 16 as the daily cycle low. The dollar did begin a new daily uptrend. A close back above the upper daily cycle band would affirm the daily uptrend and indicate that the June daily cycle low was also an intermediate cycle low.
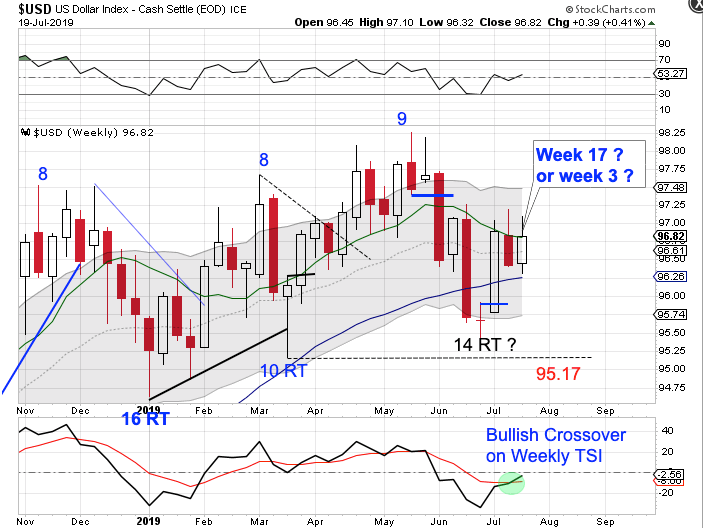
We are still uncertain if week 14 hosted an ICL. We would need to see a convincing close above the 10 week MA before we could label week 14 as the ICL. The dollar is becoming squeezed by the declining 10 week MA and the rising 50 week MA. A break out of this consolidation should result in a trending move. Currently, the dollar is in a weekly downtrend. It will remain in its weekly downtrend unless it closes above the upper weekly cycle band.
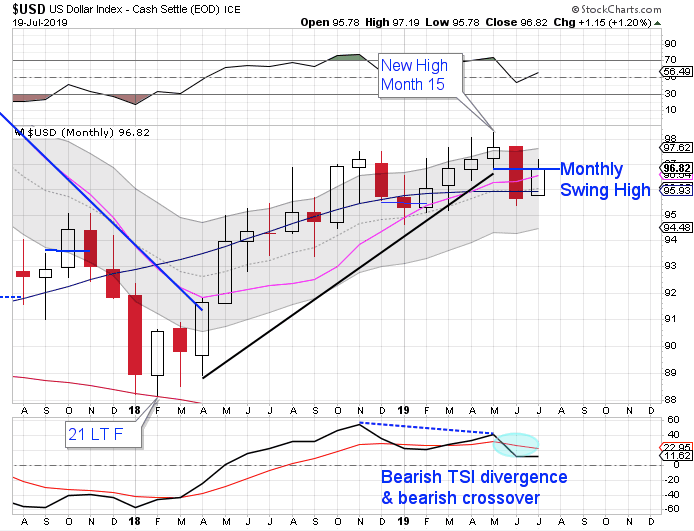
July is month 17 for the yearly dollar cycle. The dollar's yearly cycle averages 9.7 months so that places the dollar late in its timing band for a yearly cycle decline. The dollar formed a monthly swing high and closed below both the 10 month MA and the 50 month MA in June to signal the yearly cycle decline. The dollar needs some bearish follow through in order to complete its yearly cycle decline. The dollar currently is in a monthly uptrend. It will remain in its monthly uptrend unless it closes below the lower monthly cycle band.
Stocks
The daily equity cycle peaked on Monday, day 29, formed a swing high on Tuesday and closed below the 10 day MA on Wednesday to signal the daily cycle decline.
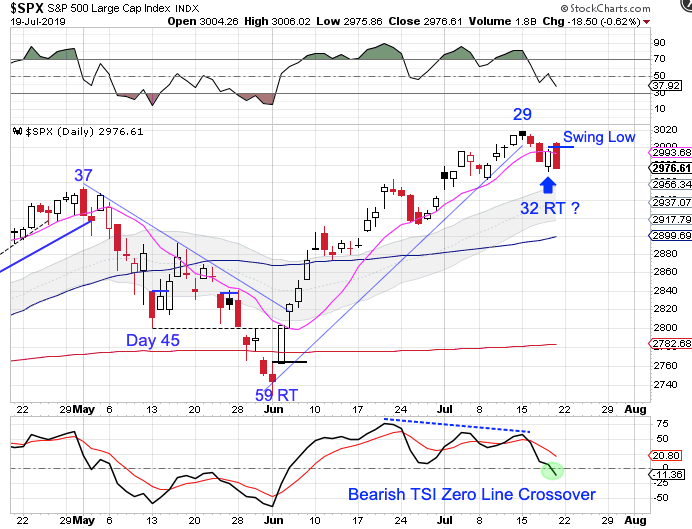
The high on day 29 locks in a right translated daily cycle formation. Stocks printed their lowest point on Thursday, day 32. That places stocks in the early part of its timing band for a daily cycle low. While stocks formed a swing low on Friday, the bearish close favors a continuation of the daily cycle decline. Stocks are currently in a strong daily uptrend. Stocks will remain in their daily uptrend unless they close below the lower daily cycle band.
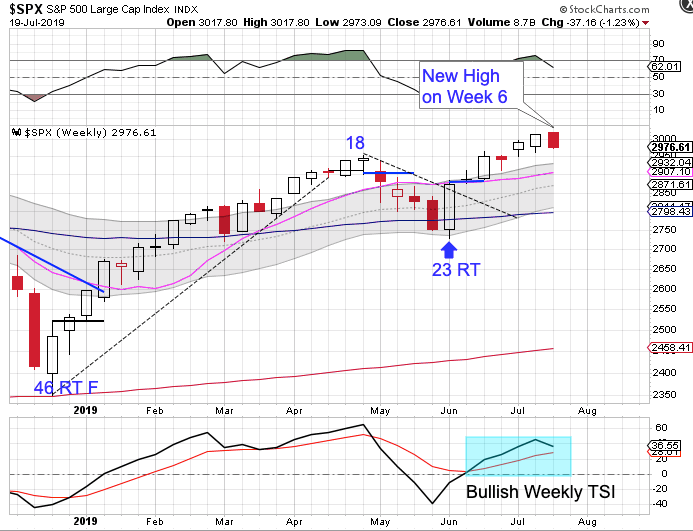
This is week 6 the new intermediate cycle. Stocks are getting a bit stretched above the 10 week MA and a decline into the pending DCL should allow for the 10 week MA to catch up to price. Stocks continue to close above the upper weekly cycle band to remain in their weekly uptrend. Stocks will continue in their weekly uptrend unless they close below the lower weekly cycle band.
Author

LikesMoney
Independent Analyst
Assets (such as stocks, gold, and the dollar) have identifiable cycles.


