Weekend Report Preview

The Dollar
The dollar printed a bearish reversal on Friday.
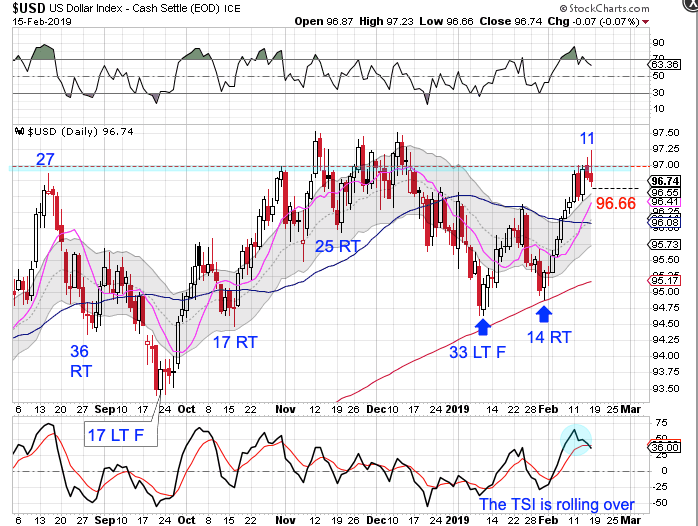
We discussed how the 97 level was a resistance level for the dollar. The dollar had four attempts to close above it and was soundly rejected by it on Friday. This has me expecting the dollar to now decline into its daily cycle low. Since the previous daily cycle was shortened we could see an extended daily cycle form here, which would make it likely to see a left translated daily cycle formation.
The dollar has not yet completed its yearly cycle decline. A left translated daily cycle formation would align with the dollar completing its yearly cycle decline. And a left translated daily cycle formation would indicate that this is week 21 for the intermediate dollar cycle.
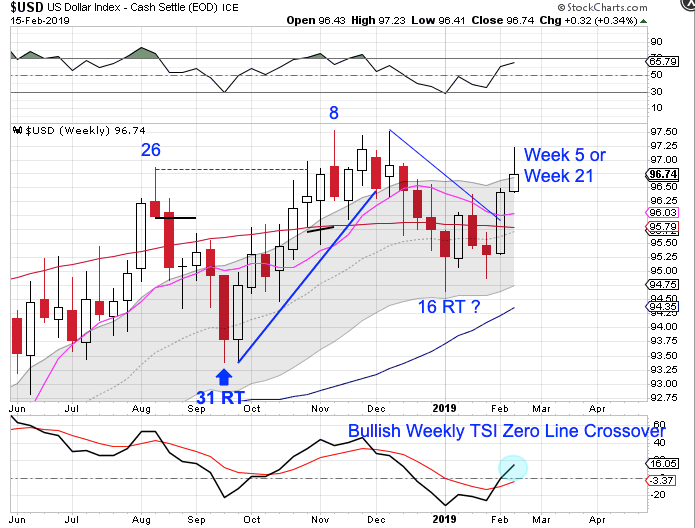
The status of the intermediate dollar cycle is unclear. As the dollar was declining into the week 16 low in January, that placed the yearly cycle at month 11. 16 weeks is too early to expect an ICL. And since 11 months is in the timing band for a yearly cycle low, we were expecting to see a left translated, failed weekly cycle form to complete the yearly cycle decline. Instead there was 3 weeks of volatility before the dollar began to rally. But since there was no failed weekly cycle to complete the yearly cycle decline and week 16 is too early to expect an intermediate cycle low, it is possible that this is week 21. If the daily cycle left translates, then we would label this as week 21. But if the daily cycle right translates, then this is likely week 5 of a new intermediate cycle. The dollar is in a weekly uptrend. It will remain in its uptrend unless it closes below the lower weekly cycle band.
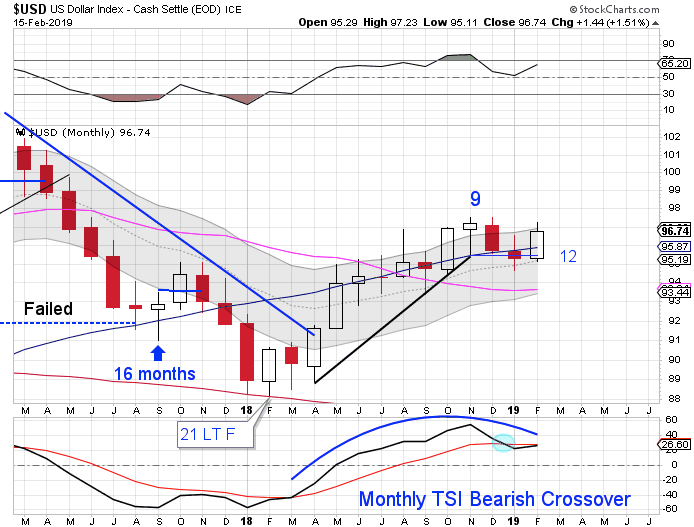
The yearly dollar cycle peaked on November, month 9. It printed it lowest point in January, month 11, placing the dollar in its timing band for a yearly cycle low. As we discussed, there has not been a failed weekly cycle to confirm the yearly cycle decline which makes February month 12 for the yearly dollar cycle. The dollar is in a monthly uptrend. It will remain in its monthly uptrend unless it closes below the lower monthly cycle band.
Closing above the upper monthly cycle band in October confirms that February 2018 hosted the 3 year cycle low. The 15 year super cycle decline has begun. As long as the dollar does not form a higher yearly cycle high, then it will remain in its 15 year super cycle decline.

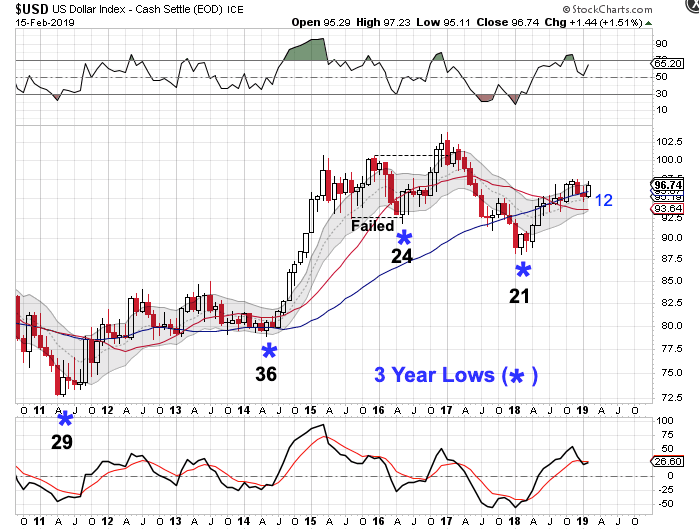
The dollar cycles through a 15 year super cycle. Each 15 year super cycle is embedded with five 3 year cycles. The dollar’s last 15 year super cycle peaked in 2001 on month 106, then declined into its third 3 year cycle low. The topping pattern in 2001 is similar to the current set up. The confirmation of a failed 3 year cycle back in August, 2017 confirms that the dollar has begun its 15 year super cycle decline (bear market). Therefore we are looking for the dollar to be rejected by the declining multi year trend line to continue its decline into the 15 year super cycle low.
Stocks
Stocks closed above the 200 day MA on Friday.
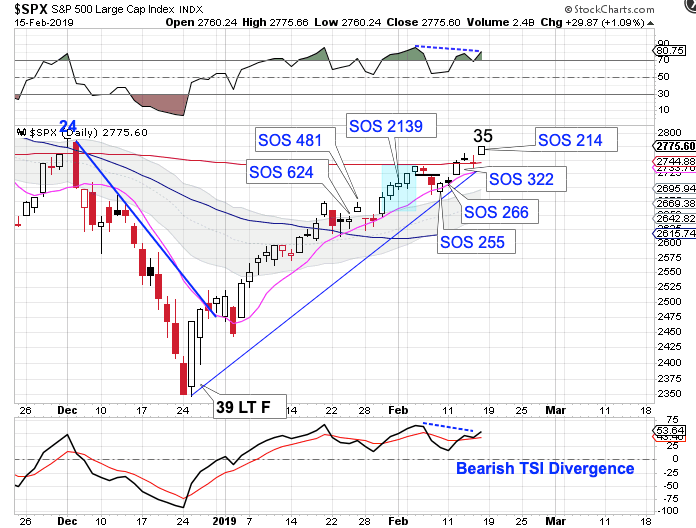
Friday was day 35, placing stocks in their timing band for a daily cycle decline. And stocks continue to print large SOS days. Now 11 of the preceding 16 days printed strong Selling on Strength numbers.
* Stocks are in their timing band for a daily cycle decline.
* Stocks continue to print SOS numbers which are harbingers that a cycle decline is imminent.
* Bearish divergences are developing on the oscillators which typically precede a cycle decline.
Once a swing high forms it will likely send stocks into their daily cycle decline. But stocks are in a daily uptrend. once the cycle decline begins, if the swing low forms above the lower daily cycle band that will mean that stocks remain in their daily uptrend and that would trigger a cycle band buy signal.
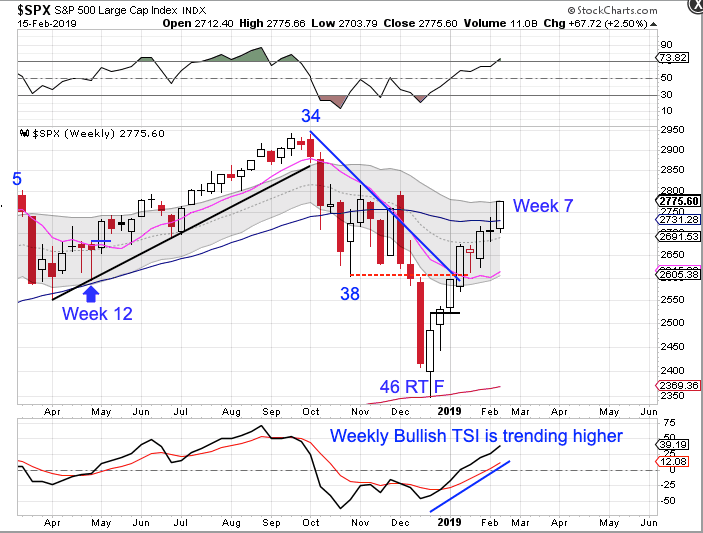
This is week 7 and the weekly chart continues to develop bullishly with stocks closing above the 50 week MA. A close above the upper weekly cycle band would end the weekly downtrend and begin a weekly uptrend. And since we suspect that week 46 marks the YCL, our expectation is to see this first intermediate cycle form as a right translated weekly cycle.
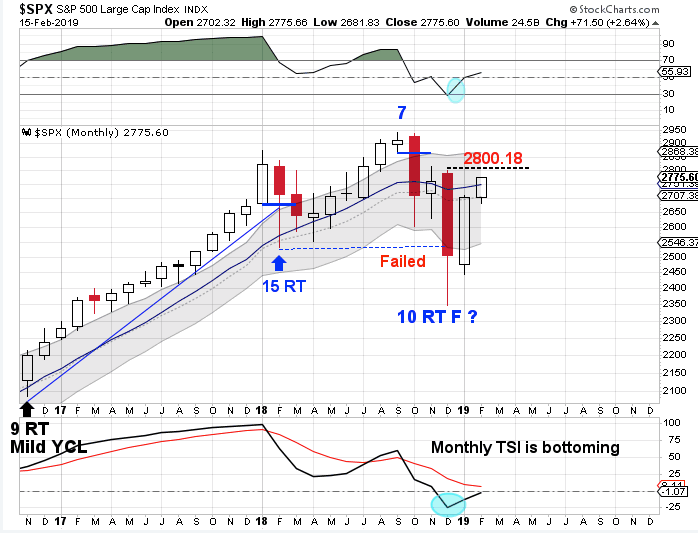
December was month 10 for the yearly equity cycle, placing stocks in their timing band for a yearly cycle low. Therefore, the new intermediate cycle should trigger the start of a new yearly cycle. A monthly swing low is required to form a yearly cycle low. A break above 2800.18 will form a monthly swing low.
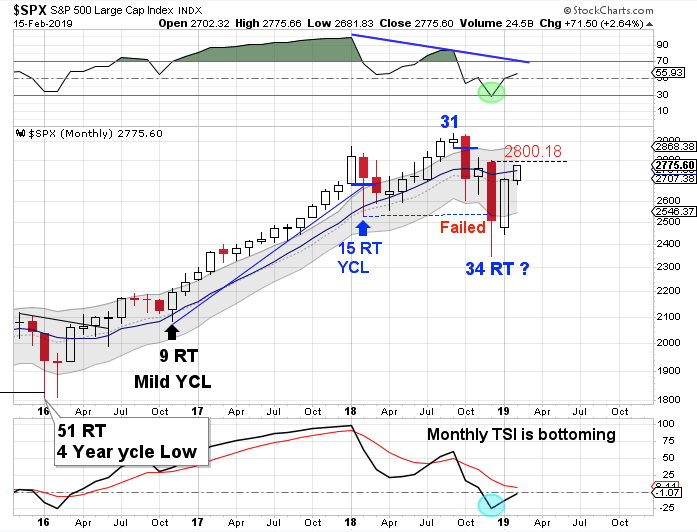
Stocks print their multi-year cycle low on average every 44 months. The last multi-year low formed in 2016 at 51 months. With that multi-year cycle being slightly stretched indicates that this one could be shortened. Therefore it is possible that December hosted a shortened, 34 month, multi-year low. A close back above the upper monthly cycle band will confirm that December was the multi-year low.
Author

LikesMoney
Independent Analyst
Assets (such as stocks, gold, and the dollar) have identifiable cycles.


