Weekend Report Preview

The Dollar
The dollar formed a daily swing high on Friday.
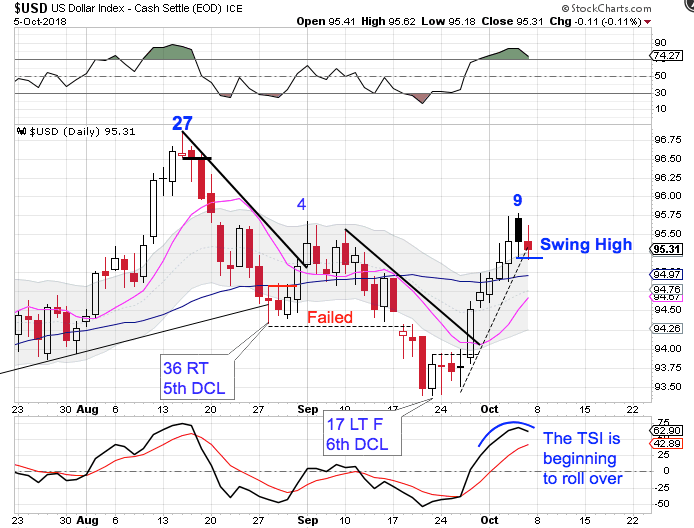
The dollar formed in intermediate cycle low in September. Typically the first daily cycle for a new intermediate cycle forms as a right translated daily cycle. Friday's swing high is a signal that this daily cycle could left translate. I believe that the 200 week MA is providing resistance that caused the daily swing high on Friday.
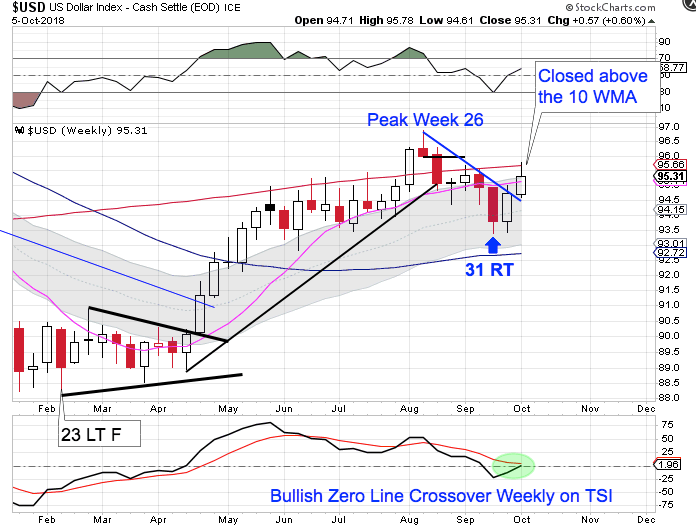
The dollar printed its lowest point the previous week, week 31, placing it deep in its timing band for an ICL. A weekly swing low has formed. The dollar closed above both the declining weekly trend line and the 10 week MA to confirm the new weekly cycle. But as we can see, the dollar ran into resistance at the 200 week MA.
Rejection by the 200 week MA would cause the dollar to form an extremely left translated weekly cycle formation. An extremely left translated weekly cycle formation aligns with the dollar declining into a 15 year super cycle low.

August remains as the yearly cycle high. The new high on month 6 begins to shift the odds towards a right translated yearly cycle formation. A right translated yearly cycle formation would align with February hosting an early 3 year cycle low.
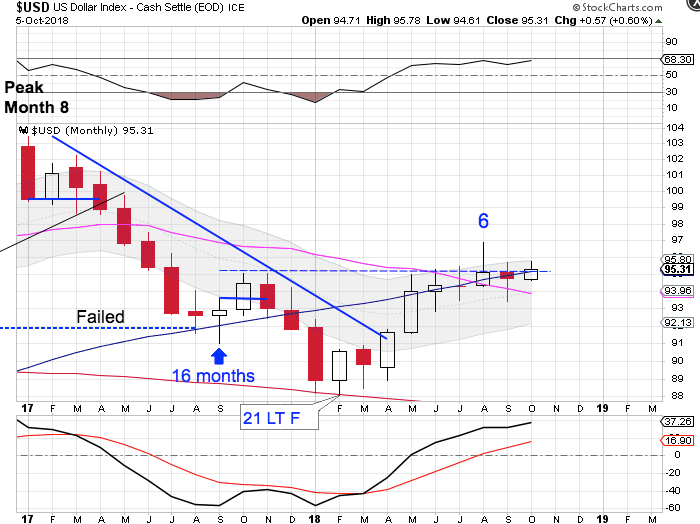
The decline into the 2014 and the 2016 three year cycle lows were somewhat mild. I highlighted the decline into the 2011 three year cycle low and the decline into the February low. The decline into the February low does have the look of a three year cycle decline. I think that we need to proceed with February being labeled as an early 3 year cycle low.
The dollar did break above convergence of the declining 20 month MA and the 50 month MA to confirm that February hosted a yearly cycle low. But a bearish monthly reversal formed in August. A close back below the 20 month MA will signal that the new 3 year cycle has topped and that the dollar is continuing its decline into its 15 year super cycle low.
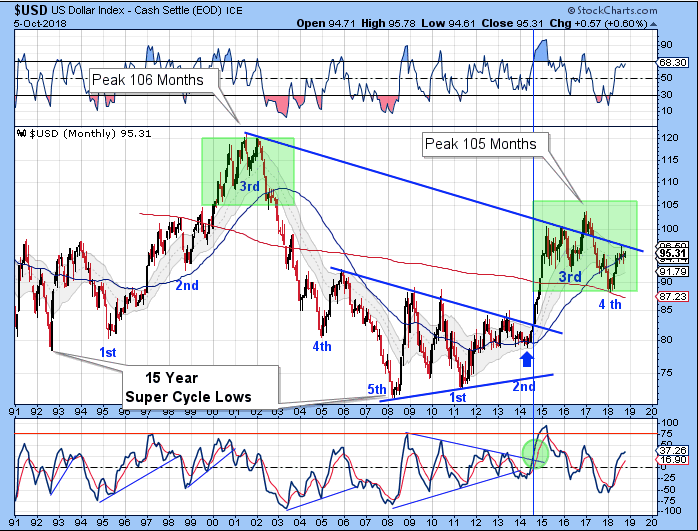
The dollar cycles through a 15 year super cycle. Each 15 year super cycle is embedded with five 3 year cycles. The dollar’s last 15 year super cycle peaked in 2001 on month 106, then declined into its third 3 year cycle low. The topping pattern in 2001 is similar to the current set up. The confirmation of a failed 3 year cycle back in August, 2017 confirms that the dollar has begun its 15 year super cycle decline (bear market). Therefore we are looking for the dollar to be rejected by the declining multi year trend line to continue its decline into the 15 year super cycle low.
Stocks
Stocks closed below the 10 day MA on Thursday and delivered bearish follow through on Friday to confirm the daily cycle decline.
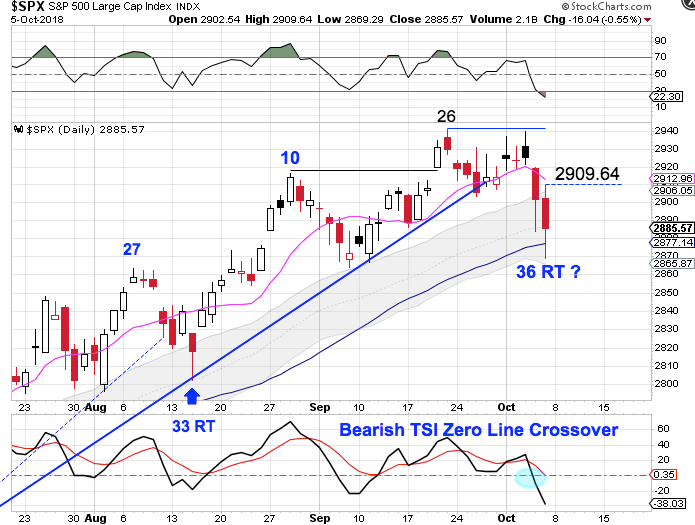
The peak on day 26 locks in a right translated daily cycle formation. Friday was day 36, placing stocks in their timing band for a DCL. A break above 2909.64 forms a swing low to signal a new daily cycle. Stocks are in a daily uptrend. If a swing low forms above the lower daily cycle band that will indicate that stocks remain in their daily uptrend and trigger a cycle band buy signal.
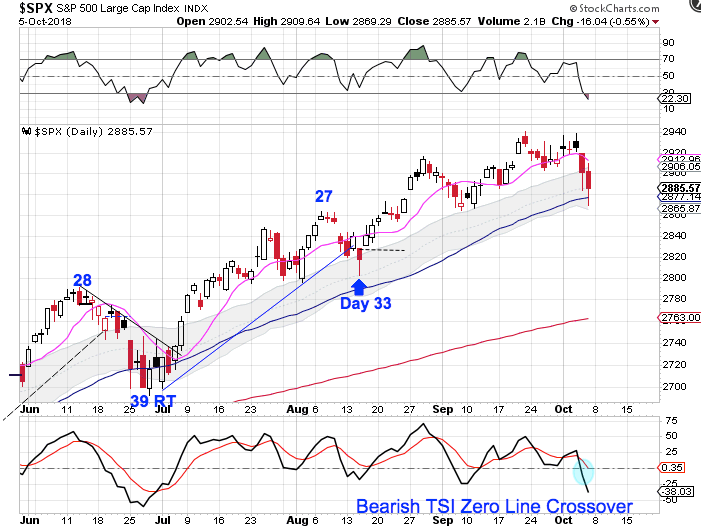
A longer term view shows us that the daily uptrend is aligned with the 50 day MA. A close below the 50 day MA will signal the intermediate cycle decline.
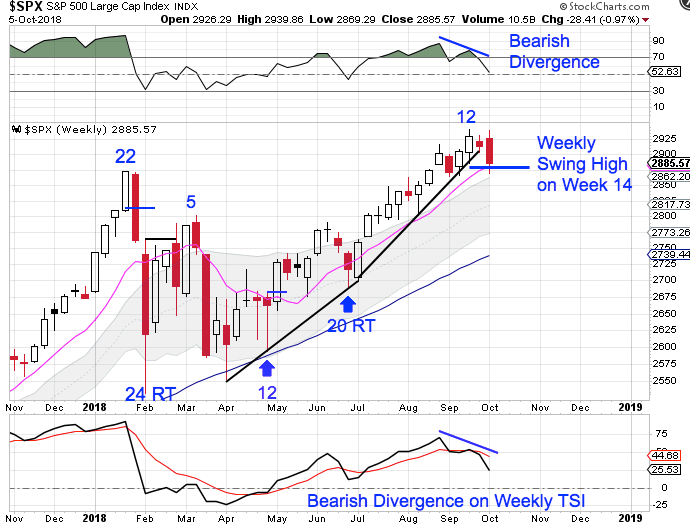
I believe that stocks were prevented from declining into the week intermediate cycle low at week 20 back in June. The current right translated daily cycle formation makes me think that this week 14. Stocks did form a weekly swing high and broke below the weekly trend line to indicate that stocks are preparing to decline into an intermediate cycle low. A close below the 10 week MA would confirm that the intermediate cycle is in decline. A failed daily cycle is needed to usher in the intermediate cycle low. So once a daily cycle low forms we will need to allow another 6 to 8 weeks for this new daily cycle to complete will bring stocks into their timing band for an ICL.
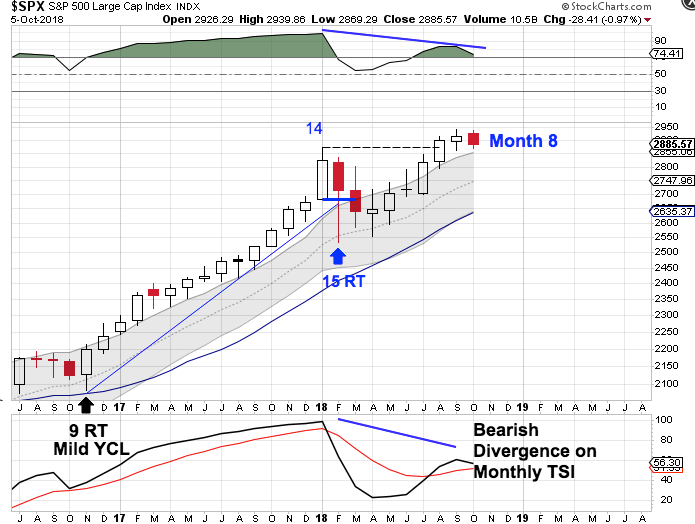
October is month 8 for the yearly equity cycle. The new high on month 7 shifts the odds towards a right translated yearly cycle formation. Stocks are firmly in a yearly uptrend. However, bearish divergences are beginning to develop on the monthly oscillators. If stocks form a monthly swing high and close back below the upper monthly cycle band that would be our signal that stocks are declining into their yearly cycle low.
Author

LikesMoney
Independent Analyst
Assets (such as stocks, gold, and the dollar) have identifiable cycles.


