Weekend Report Preview

The Dollar
The dollar appears to have printed a half cycle low on Wednesday.
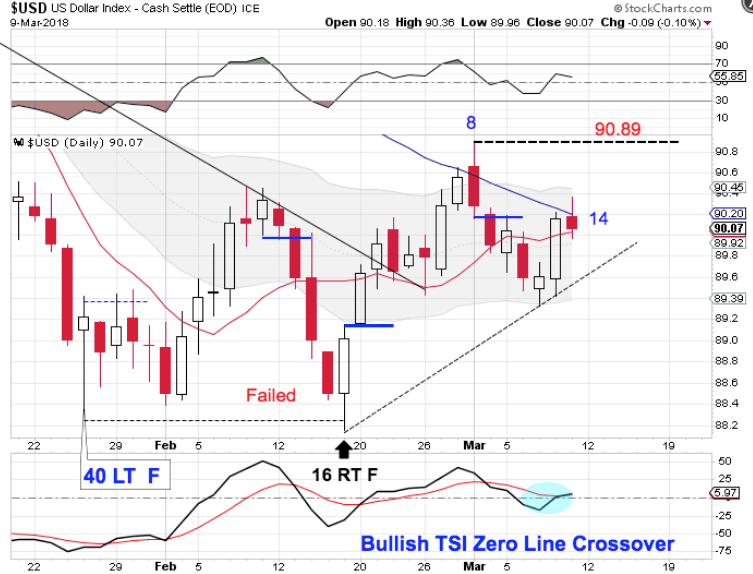
The dollar was rejected at the declining 50 day MA & then went on to lose the 10 day MA on Tues. Wednesday the dollar rallied and went on to regain the 10 day MA and form a swing low on Thursday signaling that Wednesday was a half cycle low. The dollar closed above the upper daily cycle band on day 7. Forming a swing low above the lower daily cycle band signals that the dollar has begun a new daily uptrend.
We will see on the weekly chart that the week 23 appears to have hosted the ICL. If so, then the dollar should form a right translated daily cycle. The dollar would need to break above the day 8 high of 90.89 in order to form a right translated daily cycle and confirm a new daily uptrend.
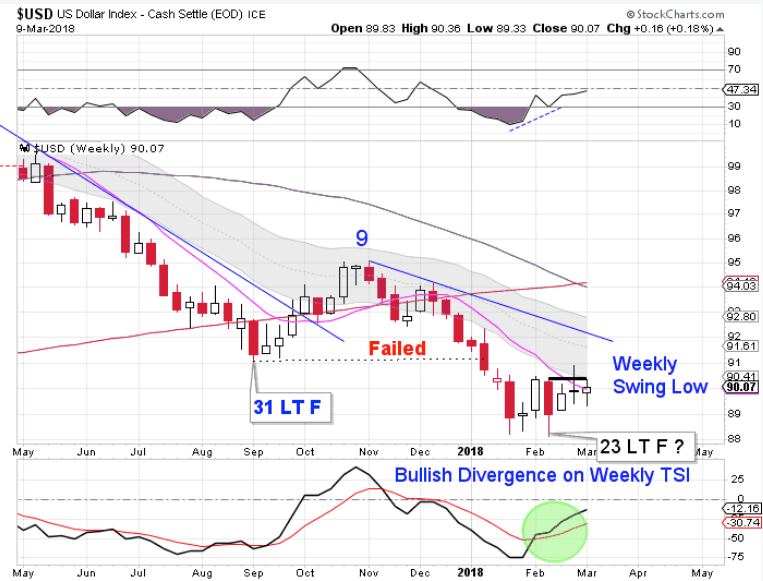
The dollar has formed a weekly swing low and pierced the 10 week MA the previous week. This week the dollar did close above the declining 10 week MA to indicate a new weekly cycle. A break above the declining trend line will confirm the new weekly cycle. The dollar is in a weekly downtrend & will remain so unless it closes above it the upper weekly cycle band.
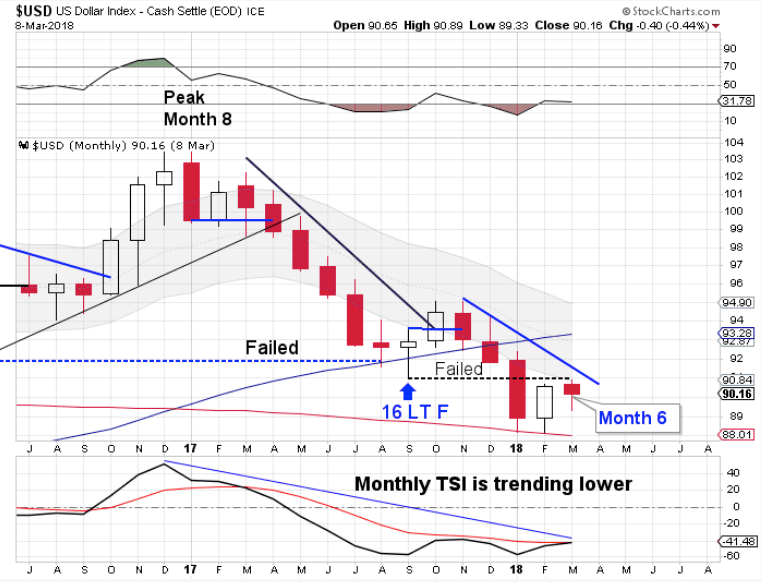
The dollar has found some support at the declining 200 month MA which makes it likely that week 23 did host the ICL. The bigger picture is that the dollar is already in a failed yearly cycle. Therefore our cyclical expectation is to see the new intermediate cycle left translate and continue the yearly cycle decline. The dollar is in a monthly downtrend. The dollar will remain in its monthly downtrend until it can close back above the upper monthly cycle band.
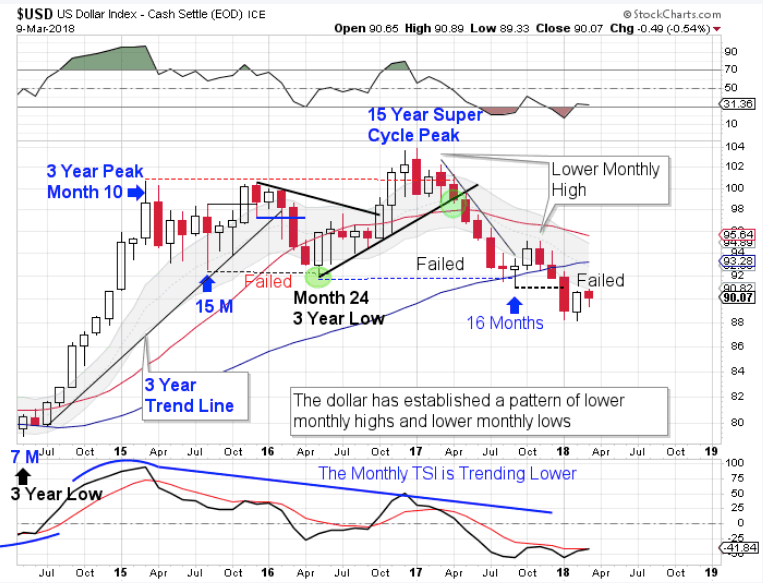
The dollar broke below the previous 3 year cycle low in September to form a failed 3 year cycle. The dollar then delivered another failed yearly cycle in January. Since the dollar broke below the May 2016 low in September to form a failed 3 year cycle it has been our expectation has been to see left translated yearly cycles form until the dollar prints its next 3 year cycle low. And with confirmation of a failed 3 year cycle, this sets up as a left translated 3 year cycle. That aligns with our 15 year super cycle analysis.
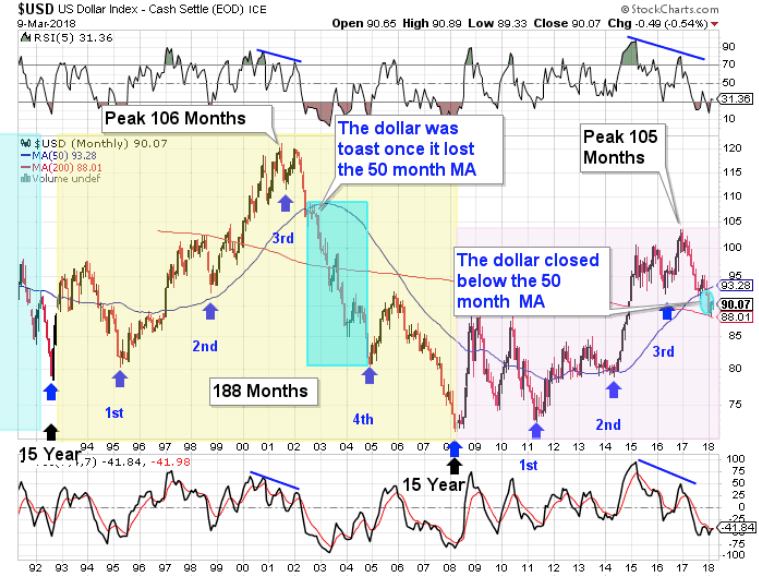
The dollar cycles through a 15 year super cycle. Each 15 year super cycle is embedded with five 3 year cycles. The dollar’s last 15 year super cycle peaked in 2001 on month 106, then declined into its third 3 year cycle low. The topping pattern in 2001 is very similar to the current set up. The confirmation of a failed 3 year cycle confirms that the dollar has begun its 15 year super cycle decline (bear market).
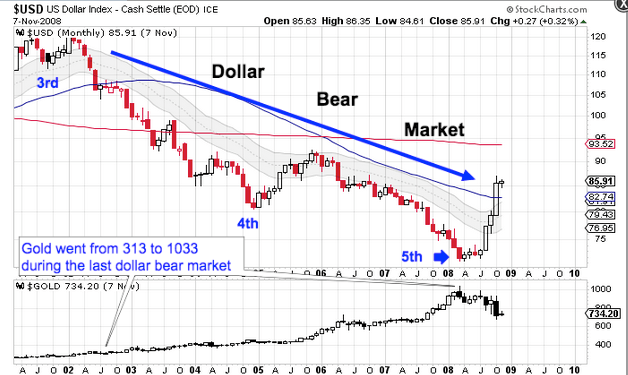
And during the last dollar bear market gold rallied over 330%.
Stocks
Stocks closed above the upper daily cycle band to reaffirm the daily uptrend.
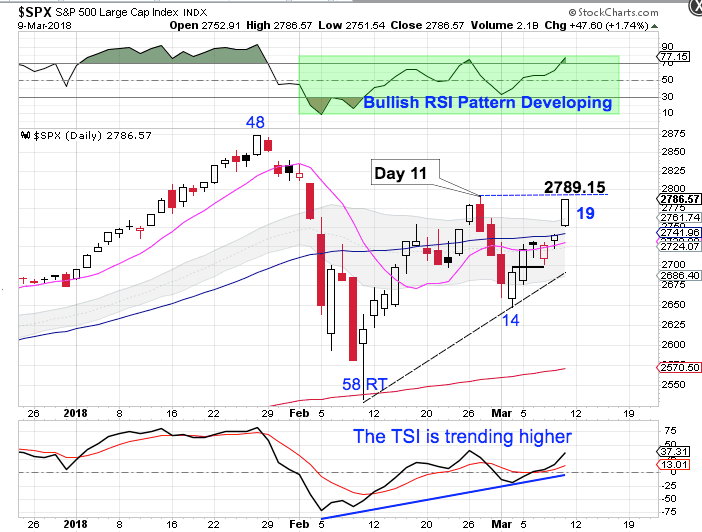
Stocks formed a swing low on Mon & regained the 10 day MA on Tues to signal that day 14 hosted a half cycle low. Friday's close above both the 50 day MA and the upper daily cycle band confirms the half cycle low. Forming a swing low above the lower daily cycle band signals that stocks remain in their daily uptrend. A break above the day 11 high of 2789.15 will assure us of a right translated daily cycle formation.
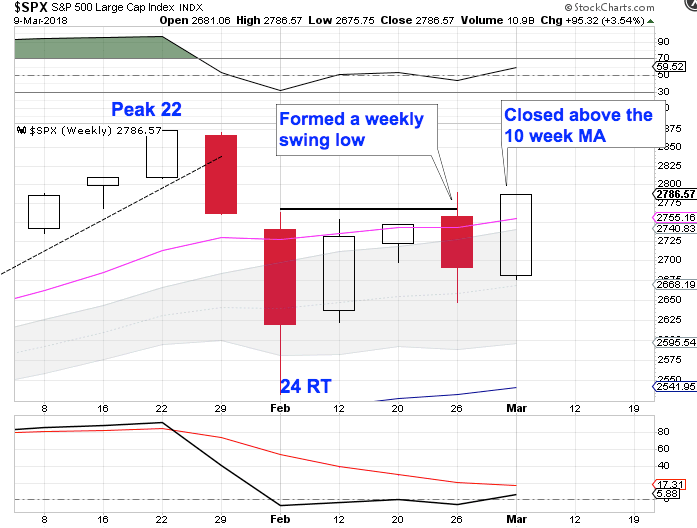
While sock formed a swing low the previous week, they did not close above the 10 week MA. This week stocks did close above the 10 week MA to confirm that week 24 hosted the ICL. Stocks continue to close above the upper weekly cycle band indicating a weekly uptrend. They will remain in their weekly uptrend unless they close below the lower weekly cycle band.
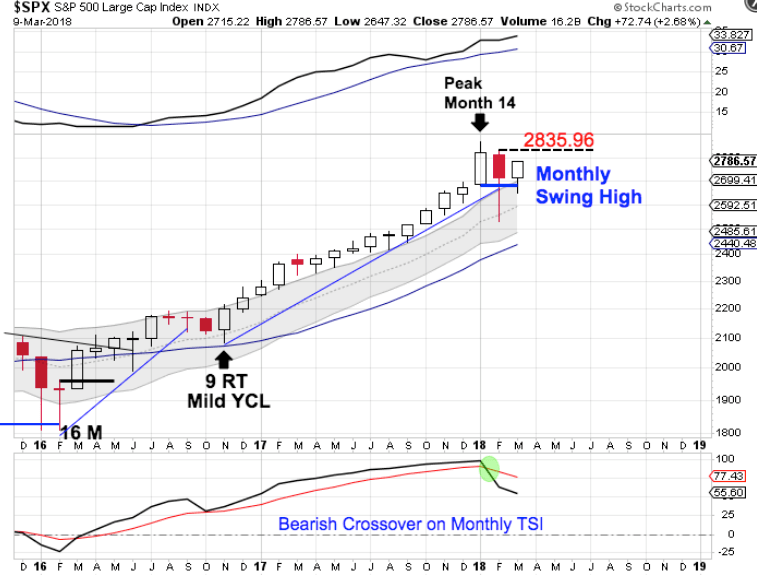
The yearly equity cycle peaked in January. February was month 15, placing stocks late in their timing band for a yearly cycle low. Stocks have formed a clear and convincing monthly swing high and delivered a break of the monthly trend line to signal the yearly cycle decline. Now once a monthly swing low forms, that will signal the new yearly cycle. A break above 2835.96 will form a monthly swing low.
Author

LikesMoney
Independent Analyst
Assets (such as stocks, gold, and the dollar) have identifiable cycles.


