Weekend Report Preview

The Dollar
The printed its lowest point on Wednesday, following the day 11 peak.
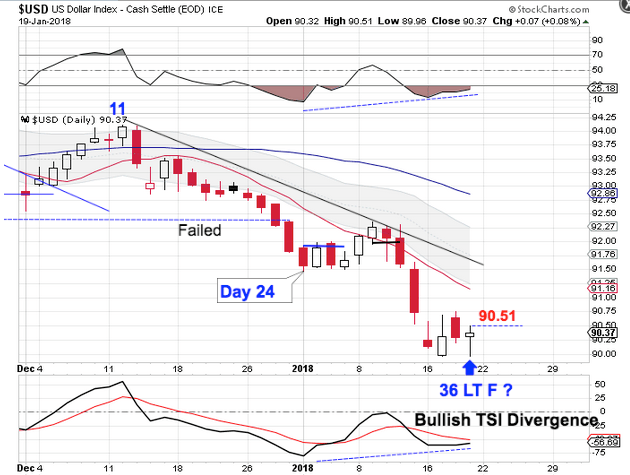
Wednesday's swing low was negated by the dollar testing the day 34 low on Friday. This extended the daily cycle out to Friday. The dollar is deep in its timing band for a DCL. A break above 90.51 forms a swing low. Then a close above the declining 10 day MA will confirm a new daily cycle. The dollar is in a daily downtrend. If the dollar forms a swing high below the upper daily cycle band it will remain in its d daily downtrend.
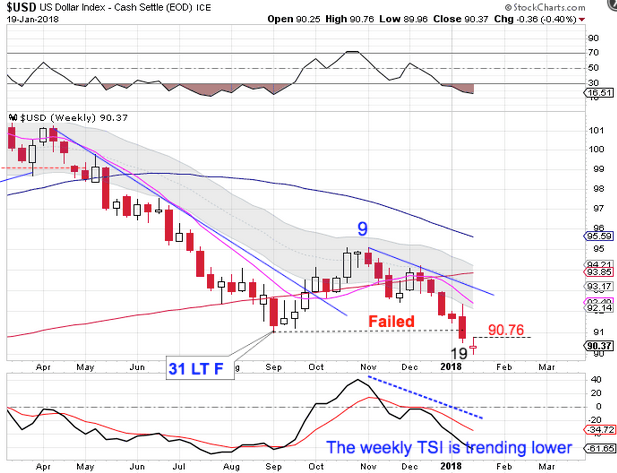
This is week 19 for the intermediate dollar cycle and the dollar formed a narrow range candle. The narrow range candle eases the parameters for forming a weekly swing low. A break above 90.76 forms a weekly swing low. Then a close above the declining 10 week MA will confirm the new intermediate cycle. The dollar is in a weekly downtrend & will remain so unless it closes above it the upper weekly cycle band.
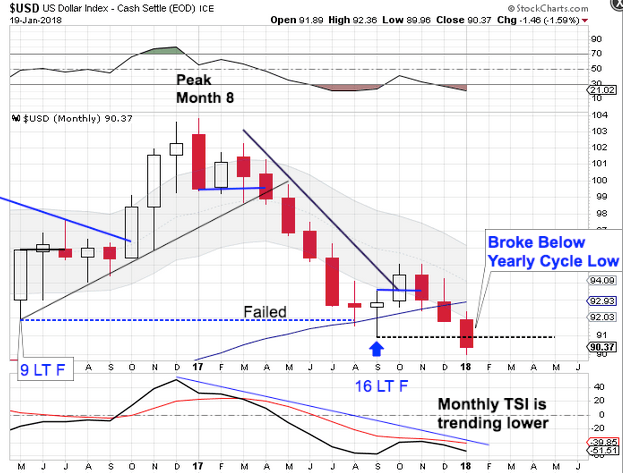
The dollar is in trouble. The dollar broke below the previous yearly cycle low to form a failed yearly cycle. Since the dollar broke below the May 2016 low in September to form a failed 3 year cycle it has been our expectation has been to see left translated yearly cycles form until the dollar prints its next 3 year cycle low. The dollar is in a monthly downtrend. The dollar will remain in its monthly downtrend until it can close back above the upper monthly cycle band.
As stated above, the dollar broke below the previous 3 year cycle low in September to form a failed 3 year cycle and now has delivered another failed yearly cycle. The remaining yearly cycles should now form as left translated yearly cycles until the next 3 year cycle low forms. And with confirmation of a failed 3 year cycle, this sets up as a left translated 3 year cycle. That aligns with our 15 year super cycle analysis.
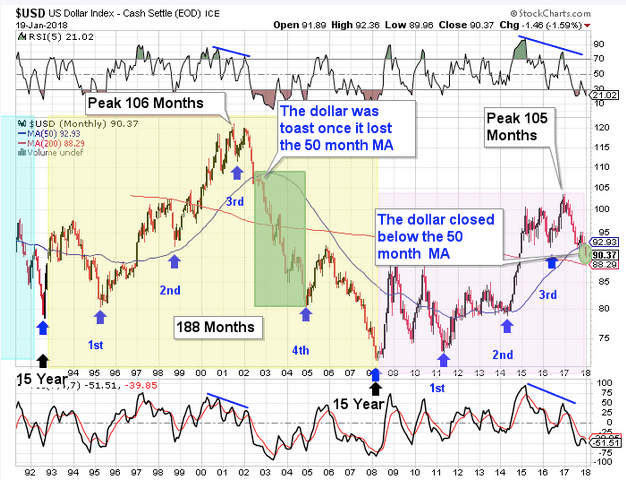
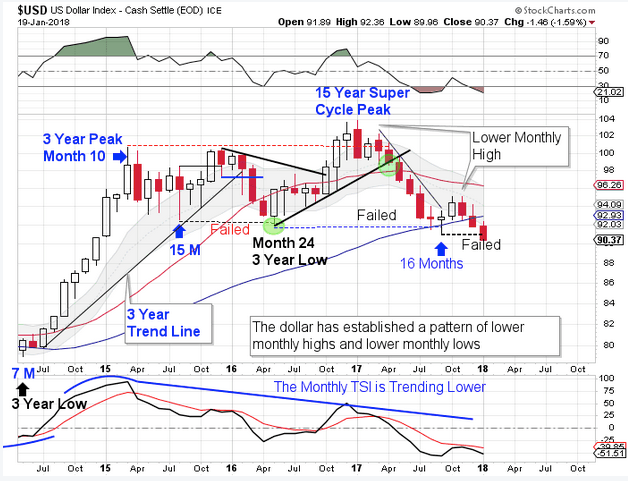
Now that the dollar has lost the 50 month MA and formed another failed yearly cycle, I expect to see the dollar begin continue lower towards the 200 month MA. The dollar cycles through a 15 year super cycle. Each 15 year super cycle is embedded with five 3 year cycles. The dollar’s last 15 year super cycle peaked in 2001 on month 106, then declined into its third 3 year cycle low. The topping pattern in 2001 is vary similar to the current set up. The confirmation of a failed 3 year cycle confirms that the dollar has begun its 15 year super cycle decline (bear market).
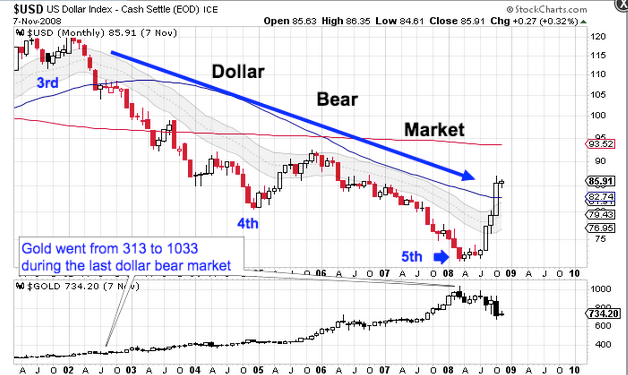
And during the last dollar bear market gold rallied over 330%.
Stocks
Stocks rallied into Friday, day 43, printing a new high. That places stocks deep in its timing band to seek out a daily cycle low.
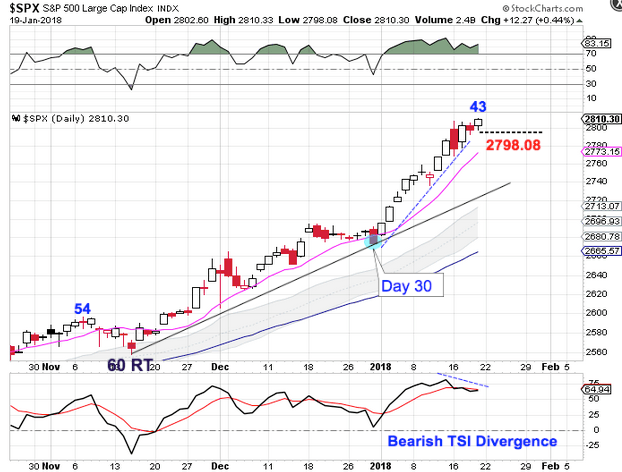
We discussed last week that day 30 did not satisfy our criteria to label it as a daily cycle low, therefore our daily cycle count has Friday as day 43. We could very well see a resolution to the government shut triggering a “sell-the-news“ event sending stocks into their daily cycle decline.
However, we need to recognize the change in character since day 30. It is clear that stocks began to accelerate since then. This highlights the importance of our cycle band tool. Our cycle band tool tells us that stocks are clearly in a daily uptrend. Since a swing low formed above the upper daily cycle band, stocks remain in their daily uptrend. And the correct strategy in an uptrend is to buy the swing low.
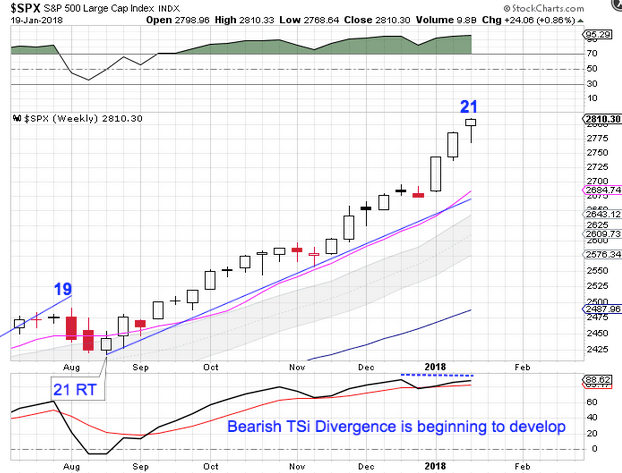
The new high on week 21 locks in a right translated weekly cycle formation. With the daily cycle extending that will likely push out the ICL until late Feb or early March. Stocks are in a weekly uptrend. They will remain in their weekly uptrend unless they close below the lower weekly cycle band.
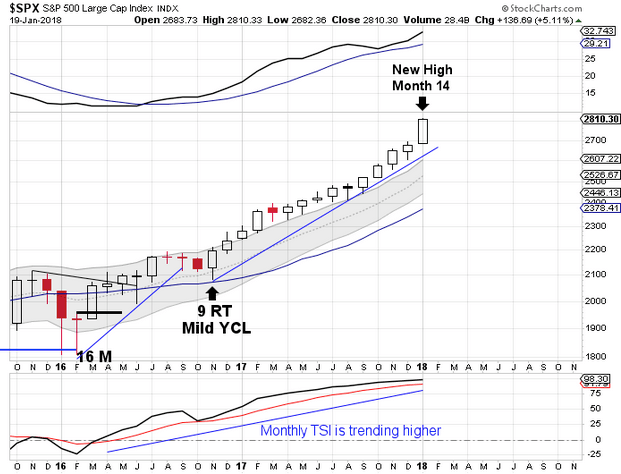
Labeling 11/16 as a yearly cycle low aligns with the change of nature that began then. Part of that change was not printing a failed daily cycle during the last 2 intermediate cycle declines. The other change is that stocks began to close above the upper monthly cycle band to establish a monthly uptrend.
Stocks broke out to another new high in January. This is month 14, placing stocks in their timing band for seeking out their yearly cycle low. Right now we are watching for a monthly swing high to signal the yearly cycle decline. Then a break of the monthly trend line will confirm the yearly cycle decline.
Author

LikesMoney
Independent Analyst
Assets (such as stocks, gold, and the dollar) have identifiable cycles.


