Walmart (NYSE: WMT) is the world’s largest company by revenue as well as the largest private employer in the world with 2.3 million employees. It’s an American multinational retailing corporation that operates as a chain of hypermarkets, discount department stores, and grocery stores. Despite being the biggest physical retailer in the world, Wal-Mart is still trailing back in e-commerce business as there is increased competition from online retailers in particular which continues to gain market share as the world is merging to online shopping.
Warren Buffet reduced his shares in Wal-Mart, which he held since 2005, by roughly 90% last quarter. He indicated that the retail sector now looks too challenging and fewer people are choosing to go to physical stores, so Walmart’s competitive advantages in scale & distribution may not be as valuable as they once were.
Walmart’s stock is only up +9% this year compared to Amazon +19% rally which already made new all time high while WMT is still far from breaking its 2015 peak. However , last week it managed to break above 2016 peak so let’s the consequence for this technical move as the giant corporation already acquired a number of e-commerce companies, which means it’s looking seriously to move into the online retail world and investors seems to be liking the new changes.
Walmart Elliott Wave View:
Walmart stock dropped 37% from 01/13/2015 peak at $90.8 before finding ground later that year. So from 2015 low, WMT could either has started a new cycle to the upside as the weekly trend remain bullish or the stock is only bouncing to correct that cycle before doing the double three correction from $90.8. Either way, the recent break above 2016 peak opened a new short term extension to the upside as WMT is now showing 5 swing bullish sequence from November 2015 low. So unless the move truncates or it’s a part of an irregular correction, then the stock has a new target that can take it toward $84 area before a larger pullback is seen.
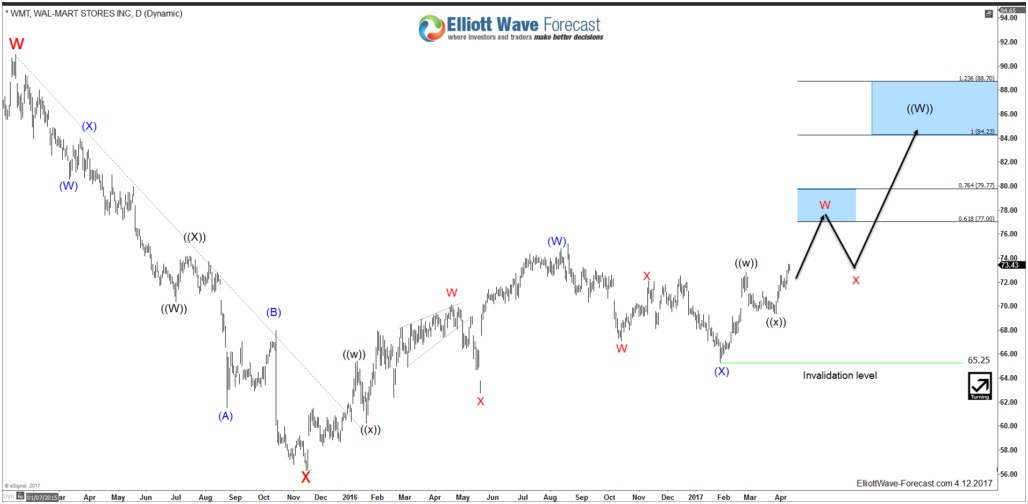
WMT established a low early this year at $65.25, from which it started a 7 swings structure move looking for a first target at equal legs area $76.62 – $78.61. From there the stock should pullback in 3 waves at least in red wave X before resuming the move higher while holding above January 2017 low.
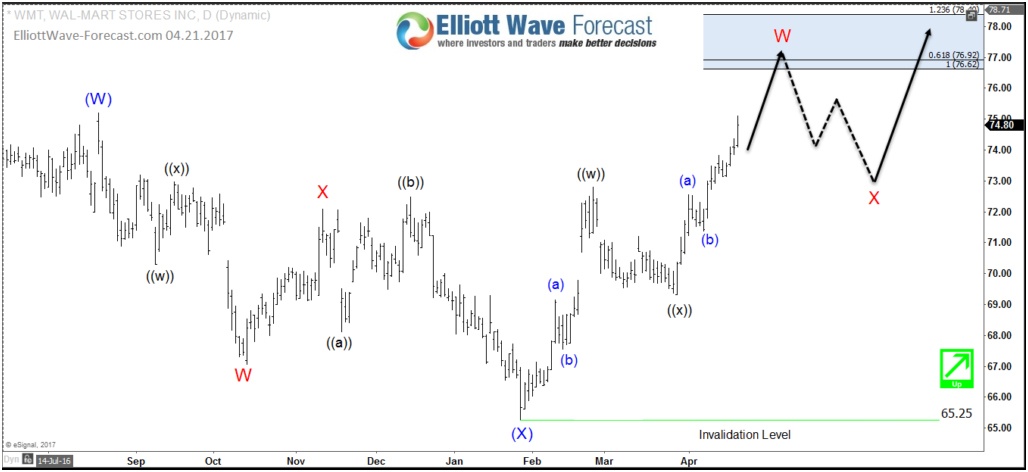
The stock doesn’t need a large pullback and could keep extending higher forming a diagonal with the current leg as wave ((iii)). The surprise would happen if the current leg higher is wave B of a Flat structure in wave (X) which means there will be a sharp 5 waves decline after ending the current leg higher. But we don’t call Flats against the main trend which remain bullish until the move happens.
Recap:
Walmart may not look as a good long term investment as it used to be but the technical bullish sequence is suggesting that WMT price will see more gains during the rest of 2017 as short term investors still believe in the company. So while this year’s low is holding, corrective pullbacks will remain supported by the bulls.
Become a Successful Trader and Master Elliott Wave like a Pro. Start your Free 14 Day Trial at - Elliott Wave Forecast.
FURTHER DISCLOSURES AND DISCLAIMER CONCERNING RISK, RESPONSIBILITY AND LIABILITY Trading in the Foreign Exchange market is a challenging opportunity where above average returns are available for educated and experienced investors who are willing to take above average risk. However, before deciding to participate in Foreign Exchange (FX) trading, you should carefully consider your investment objectives, level of xperience and risk appetite. Do not invest or trade capital you cannot afford to lose. EME PROCESSING AND CONSULTING, LLC, THEIR REPRESENTATIVES, AND ANYONE WORKING FOR OR WITHIN WWW.ELLIOTTWAVE- FORECAST.COM is not responsible for any loss from any form of distributed advice, signal, analysis, or content. Again, we fully DISCLOSE to the Subscriber base that the Service as a whole, the individual Parties, Representatives, or owners shall not be liable to any and all Subscribers for any losses or damages as a result of any action taken by the Subscriber from any trade idea or signal posted on the website(s) distributed through any form of social-media, email, the website, and/or any other electronic, written, verbal, or future form of communication . All analysis, trading signals, trading recommendations, all charts, communicated interpretations of the wave counts, and all content from any media form produced by www.Elliottwave-forecast.com and/or the Representatives are solely the opinions and best efforts of the respective author(s). In general Forex instruments are highly leveraged, and traders can lose some or all of their initial margin funds. All content provided by www.Elliottwave-forecast.com is expressed in good faith and is intended to help Subscribers succeed in the marketplace, but it is never guaranteed. There is no “holy grail” to trading or forecasting the market and we are wrong sometimes like everyone else. Please understand and accept the risk involved when making any trading and/or investment decision. UNDERSTAND that all the content we provide is protected through copyright of EME PROCESSING AND CONSULTING, LLC. It is illegal to disseminate in any form of communication any part or all of our proprietary information without specific authorization. UNDERSTAND that you also agree to not allow persons that are not PAID SUBSCRIBERS to view any of the content not released publicly. IF YOU ARE FOUND TO BE IN VIOLATION OF THESE RESTRICTIONS you or your firm (as the Subscriber) will be charged fully with no discount for one year subscription to our Premium Plus Plan at $1,799.88 for EACH person or firm who received any of our content illegally through the respected intermediary’s (Subscriber in violation of terms) channel(s) of communication.
Recommended Content
Editors’ Picks
EUR/USD trades weak below 1.0800 amid Good Friday lull, ahead of US PCE
EUR/USD remains depressed below 1.0800 after soft French inflation data, amid minimal volatility and thin liquidity on Good Friday. The pair keenly awaits the US PCE inflation data and Fed Chair Powell's speech for fresh hints on next week's price action.
GBP/USD holds steady above 1.2600 as markets stay calm on Good Friday
GBP/USD trades sideways above 1.2600 amid a typical Good Friday trading lull. A broadly firmer US Dollar could keep any upside attempts limited in the pair ahead of the US PCE inflation data and Fed Chair Powell's appearance.
Gold price sits at all-time highs above $2,230, US PCE eyed
Gold price hit all-time highs at $2,236 on Thursday to finish Q1 2024 with a bang. Most major world markets, including the US are closed due to Holy Friday, leaving volatility around Gold price highly subdued. US PCE inflation and Powell are awaited.
Jito price could hit $6 as JTO coils up inside this bullish pattern
Jito (JTO) price has been on an uptrend since forming a local bottom in early January. Since then, JTO has revisited the key swing point formed in early December, suggesting the bulls’ intention to move higher.
Key events in developed markets next week
Next week, the main focus will be inflation and the labour market in the Eurozone. We expect services inflation to be impacted by the easter effect, while the unemployment rate to be unchanged.