|

USDX forecasting the decline after Flat

Hello fellow traders. In this technical blog we're going to take a quick look at the past Elliott Wave charts of Dollar Index published in members area of www.elliottwave-forecast.com. We're going to take a look at the price structures of USDX , count the swings and explain the forecast.

USDX 4 hour update 05.09.2017

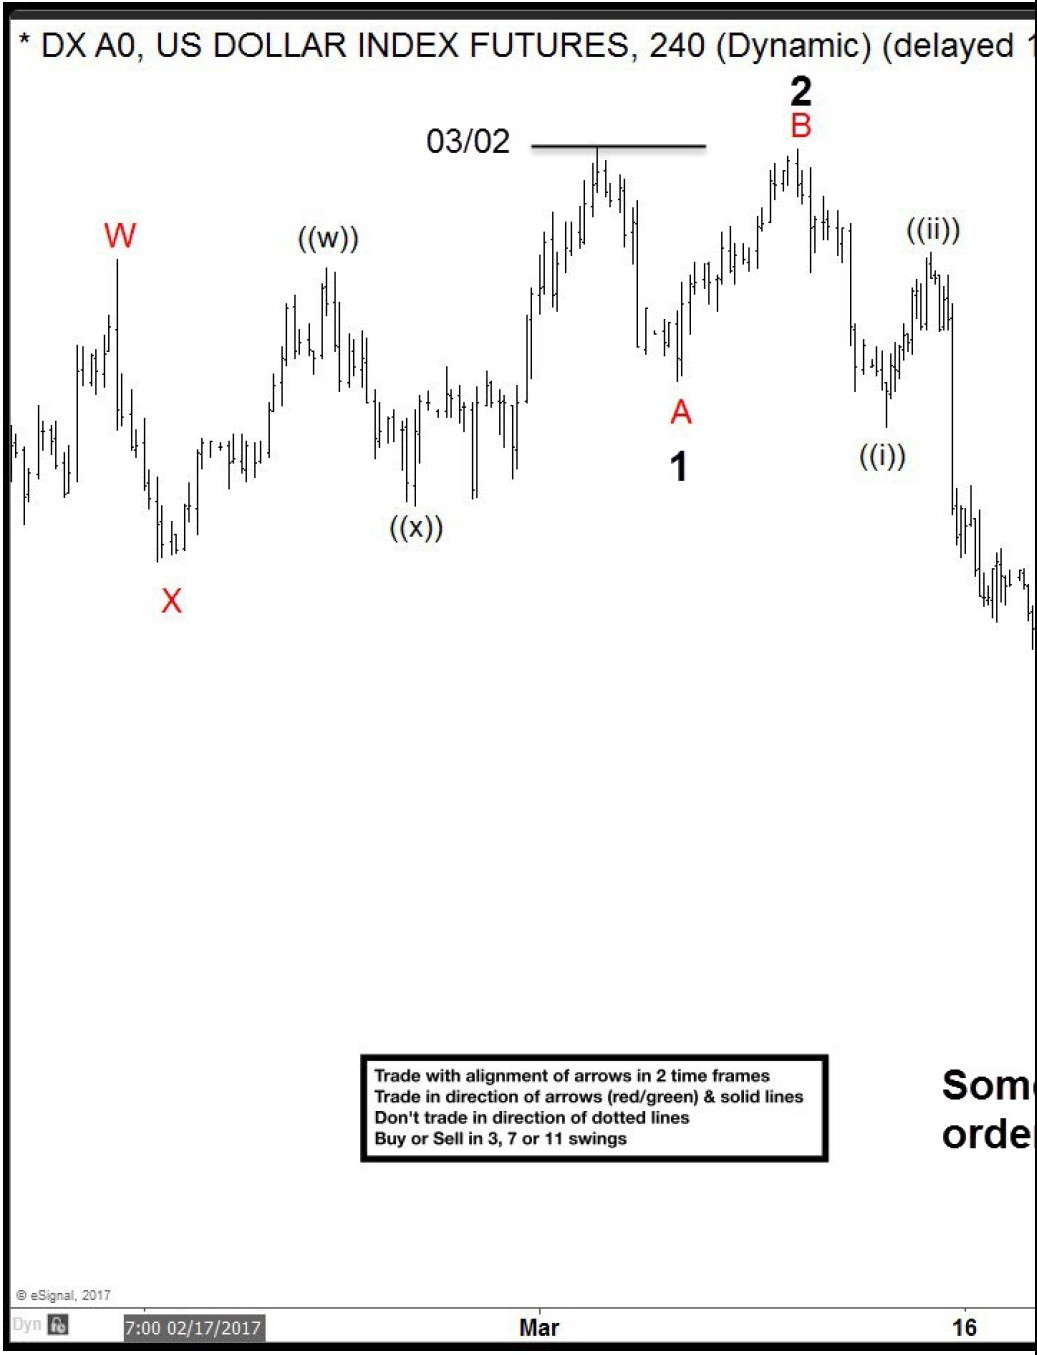
As our members know, we were pointing out that USDX is having incomplete bearish swings sequnces within the cycle from the 03/02 peak. From the chart below, we can see that USDX has a clear 5 swing from the peak, when we're about to complete 6th swing as Irregular Flat. Consequently, we're calling further weakness once proposed Flat is complete. Dollar index is targeting 97.92-96.91 area ideally.

Elliott Wave Analysis

Now let's take a look at the short term structures...

USDX 1 Hour Asia Chart 05.11.2017

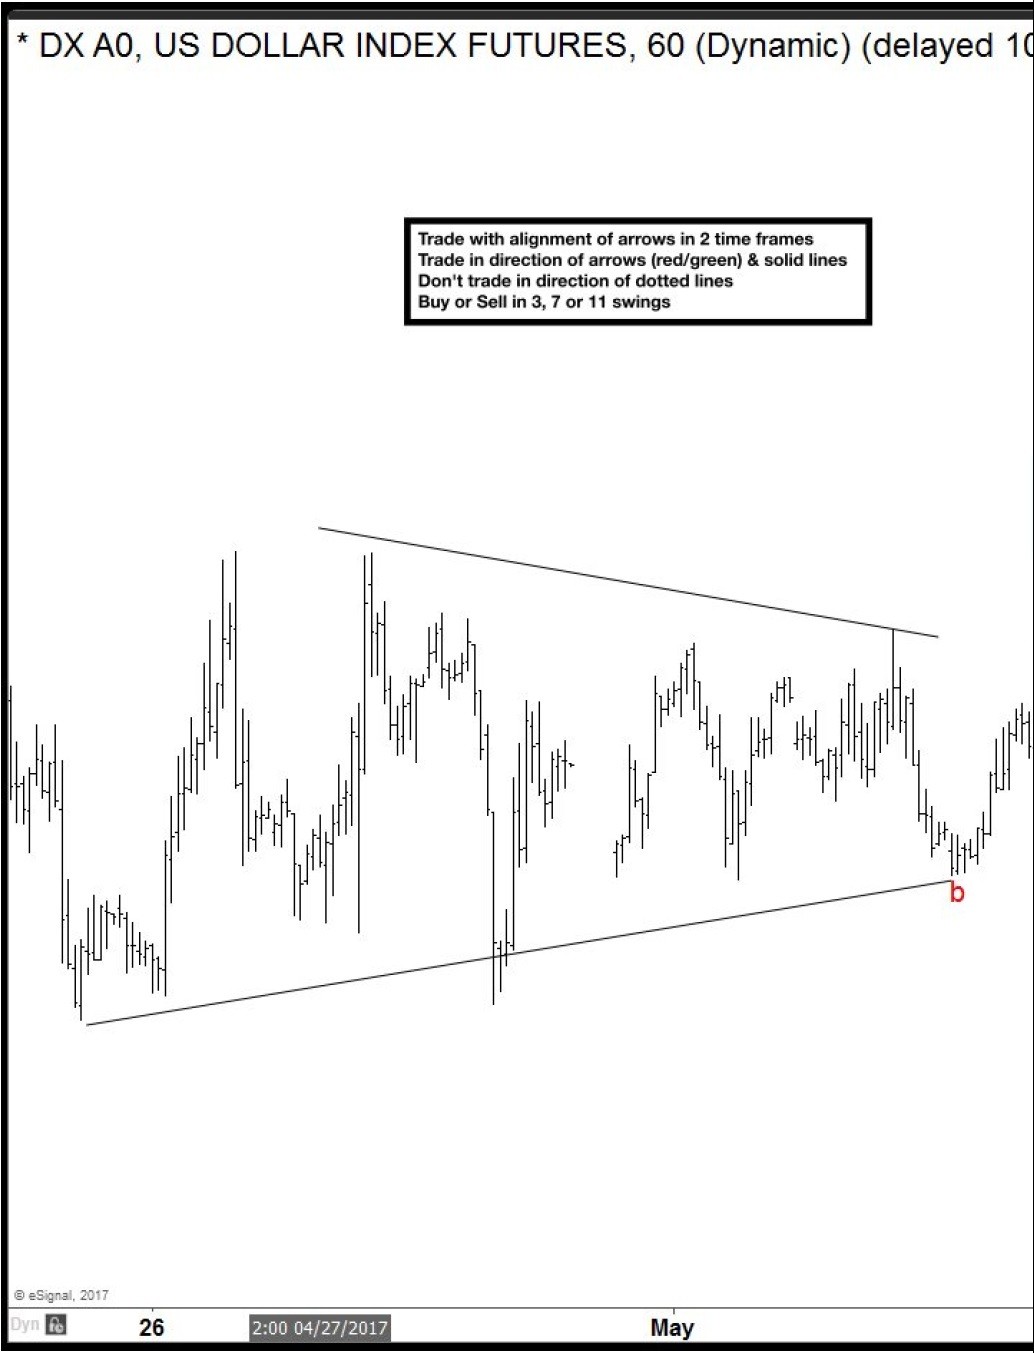
Dollar Index is about to complete wave ((x)) recovery as expanded flat structure. We got clear 5 waves from the lows that is part of wave (c) of flat. Although, the extreme area is reached at 99.64 -99.92, and we have minimum requirements for correction to complete soon, we see possibility of marginal extension higher within the blue box still.

Elliott Wave Analysis

USDX 1 Hour NY Midday Chart 05.11.2017

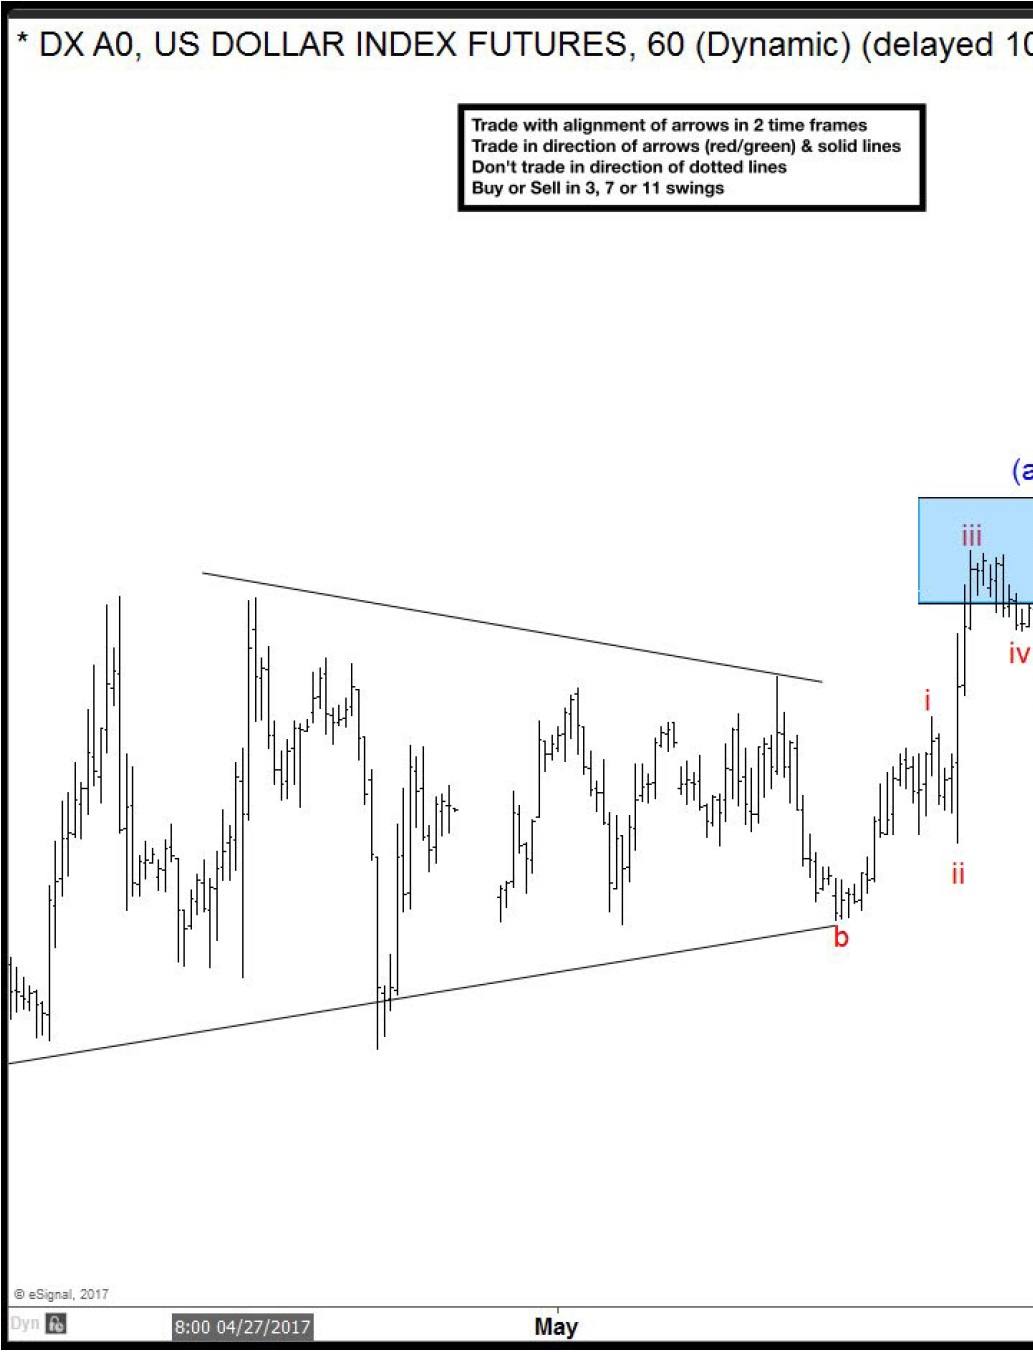
We got expected marginal extension and reaction from the blue box. Now we're calling wave ((x)) recovery completed at 99.88 peak as expanded flat. While the price stays below 99.88 peak further weakness should ideally follow.

Elliott Wave Analysis

USDX 1 Hour London Chart 05.16.2017

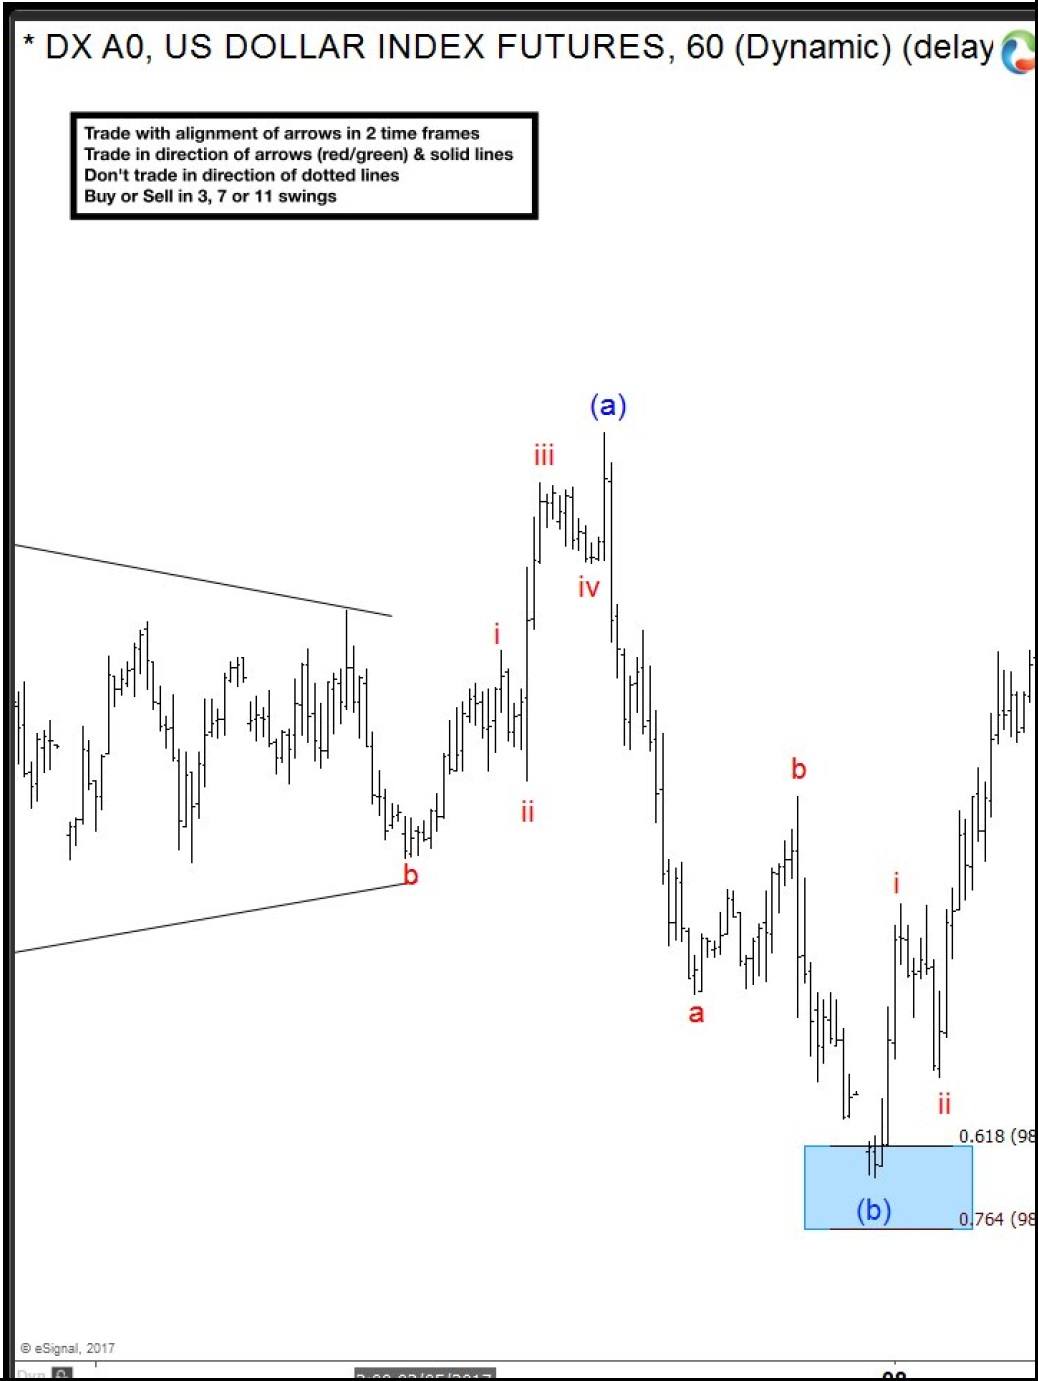
99.88 peak held nicely and USDX is now breaking lower, suggesting more downside in 7th swing towards proposed 97.92-96.91 area.

Elliott Wave Analysis

Become a Successful Trader and Master Elliott Wave like a Pro. Start your Free 14 Day Trial at - Elliott Wave Forecast.

Author

Elliott Wave Forecast Team

Elliott Wave Forecast Team

ElliottWave-Forecast.com

More from Elliott Wave Forecast Team
Share:

Editor's Picks

EUR/USD hits two-day highs near 1.1820

EUR/USD picks up pace and reaches two-day tops around 1.1820 at the end of the week. The pair’s move higher comes on the back of renewed weakness in the US Dollar amid growing talk that the Fed could deliver an interest rate cut as early as March. On the docket, the flash US Consumer Sentiment improves to 57.3 in February.

GBP/USD reclaims 1.3600 and above

GBP/USD reverses two straight days of losses, surpassing the key 1.3600 yardstick on Friday. Cable’s rebound comes as the Greenback slips away from two-week highs in response to some profit-taking mood and speculation of Fed rate cuts. In addition, hawkish comments from the BoE’s Pill are also collaborating with the quid’s improvement.

Gold climbs further, focus is back to 45,000

Gold regains upside traction and surpasses the $4,900 mark per troy ounce at the end of the week, shifting its attention to the critical $5,000 region. The move reflects a shift in risk sentiment, driving flows back towards traditional safe haven assets and supporting the yellow metal.

Crypto Today: Bitcoin, Ethereum, XRP rebound amid risk-off, $2.6 billion liquidation wave

Bitcoin edges up above $65,000 at the time of writing on Friday, as dust from the recent macro-triggered sell-off settles. The leading altcoin, Ethereum, hovers above $1,900, but resistance at $2,000 caps the upside. Meanwhile, Ripple has recorded the largest intraday jump among the three assets, up over 10% to $1.35.

Three scenarios for Japanese Yen ahead of snap election

The latest polls point to a dominant win for the ruling bloc at the upcoming Japanese snap election. The larger Sanae Takaichi’s mandate, the more investors fear faster implementation of tax cuts and spending plans. 

XRP rally extends as modest ETF inflows support recovery

Ripple is accelerating its recovery, trading above $1.36 at the time of writing on Friday, as investors adjust their positions following a turbulent week in the broader crypto market. The remittance token is up over 21% from its intraday low of $1.12.