USDPLN – Long Term PBO Forming (Weekly chart)

Price Action Context
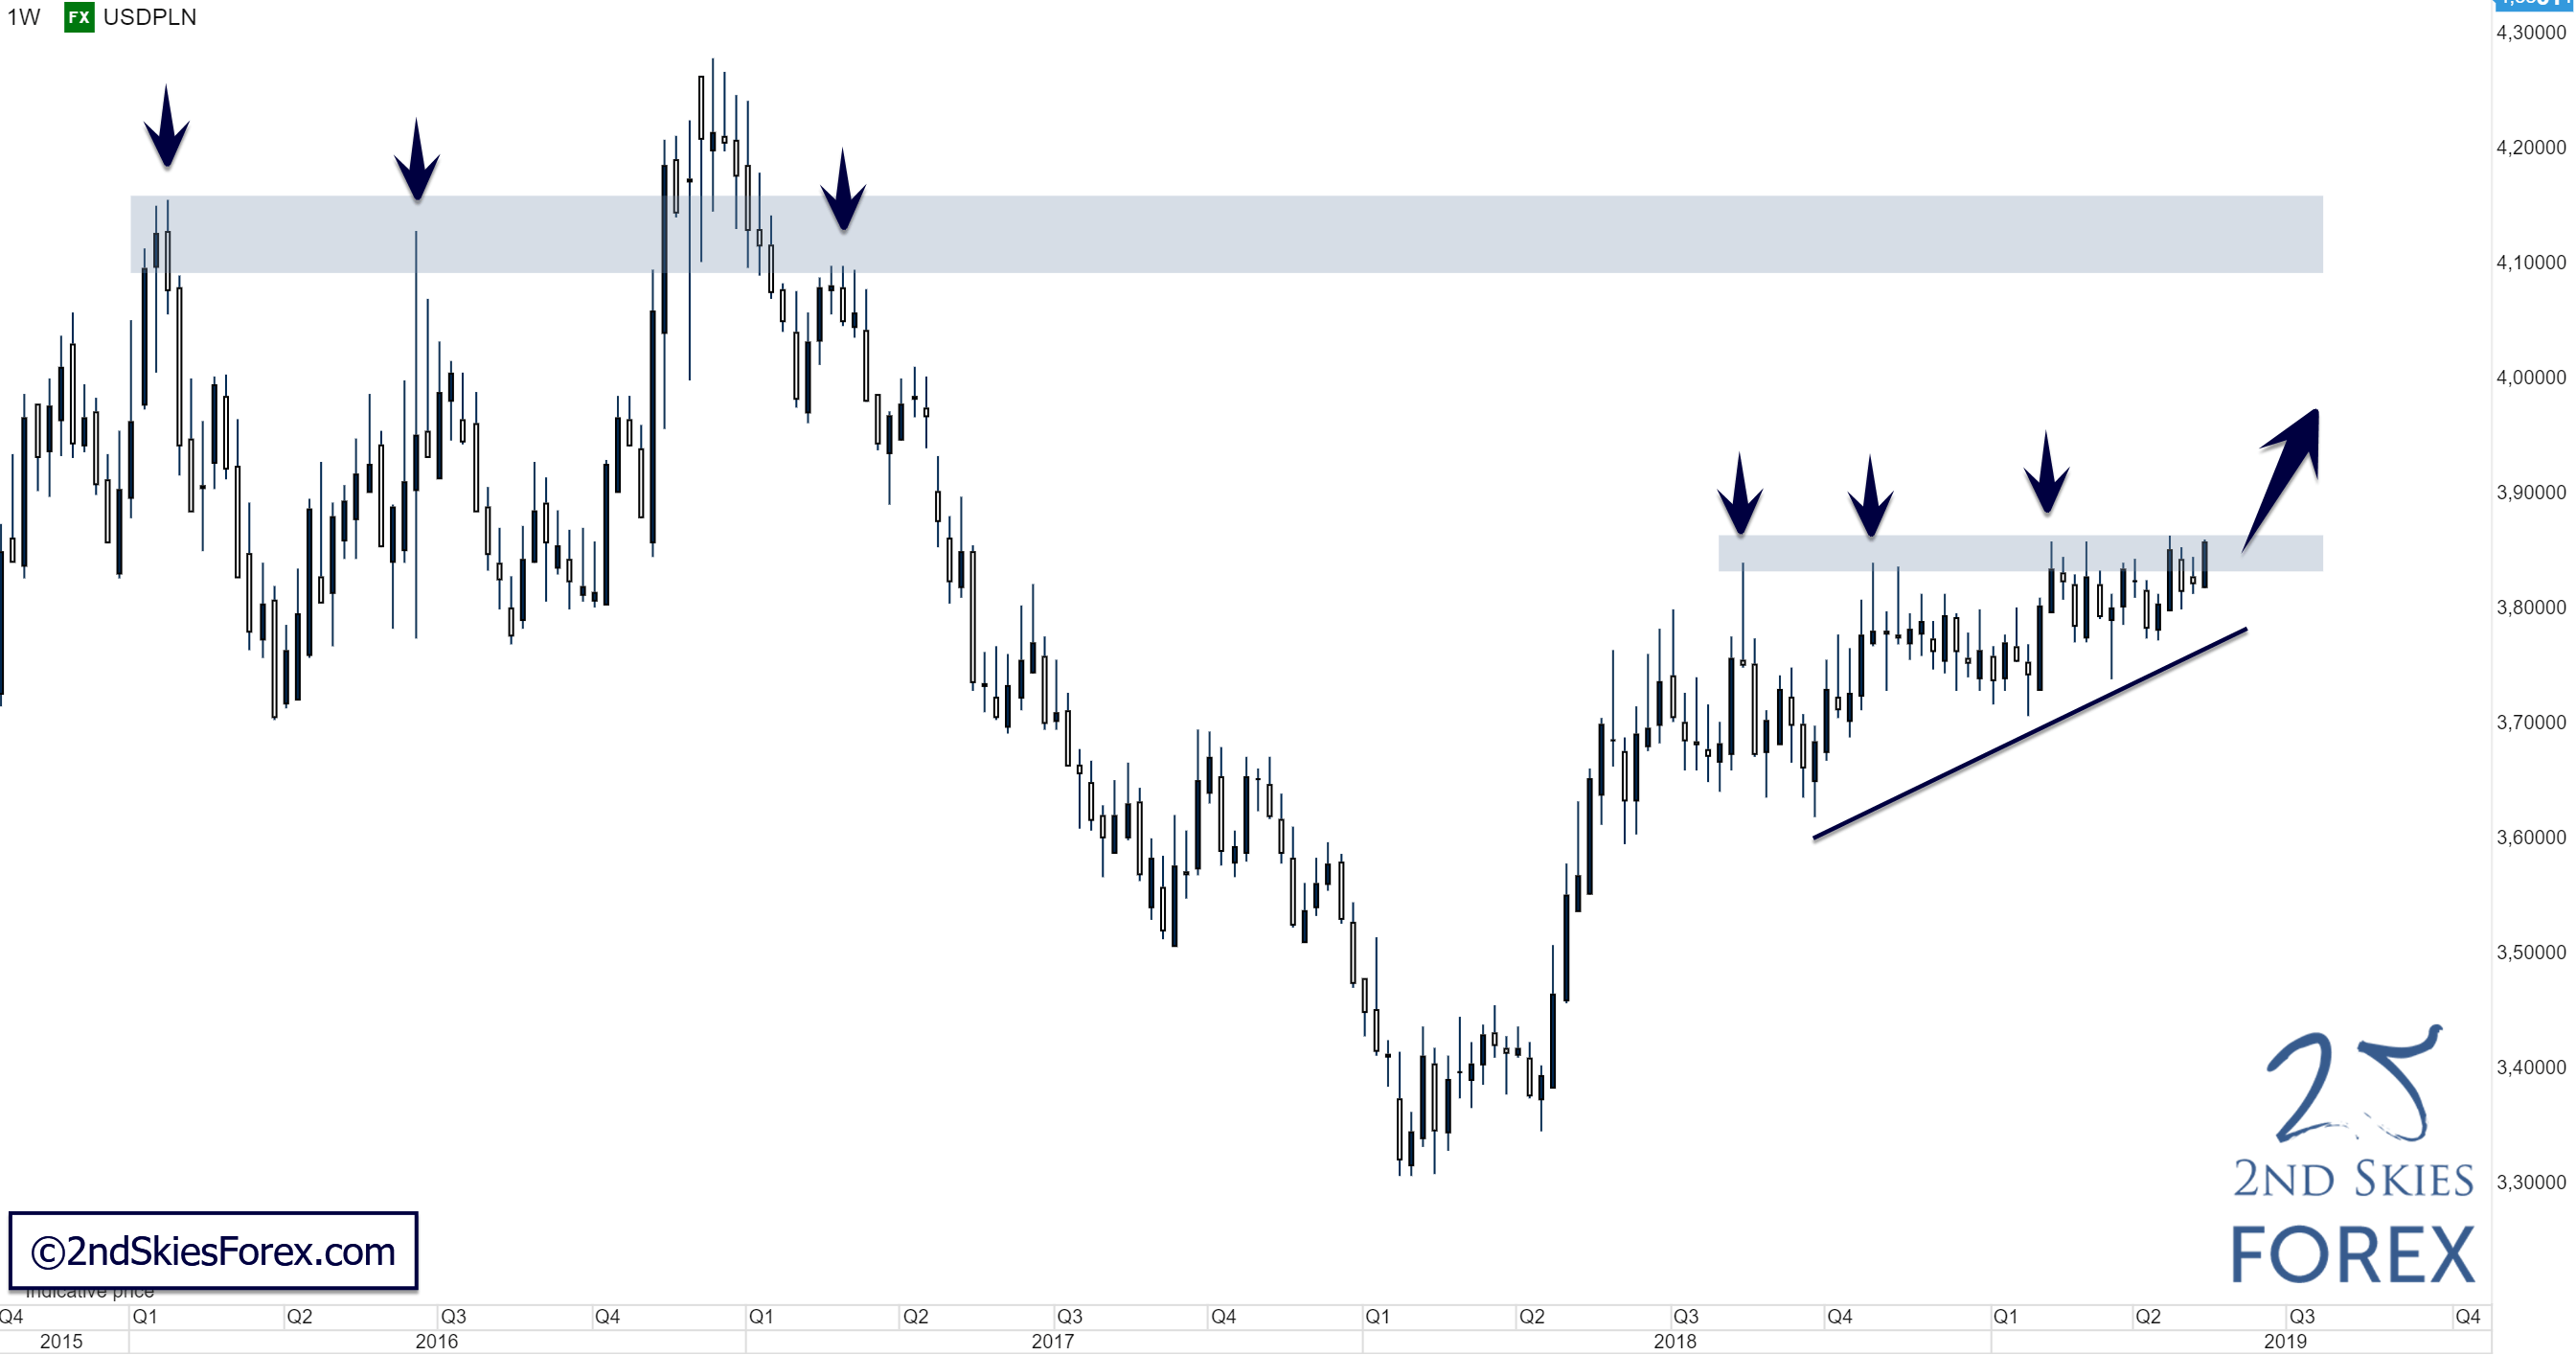
The strong bull run from ~3.30 last year has been followed by a long consolidation period which has lasted for almost a year at this point. Bulls slowly seem to be taking control though, indicated by the weaker rejections from the well-defined LT resistance, forming a LT bullish pre-breakout structure.
Trending Analysis
LT bias is bullish, and a successful breakout north would open up a lot of potential upside, with 4.10 being the next key resistance to look out for. A breakdown of this pre-breakout structure prior to a breakout, alternatively a false break at this key resistance would likely be followed by a move back down towards 3.60-3.64.
Key Support & Resistance Zones
R: 3.8350 – 3.8650
S: 3.6000 – 3.6400
Visit our website at 2ndSkies for more price action content, free trading lessons, strategies and videos. Find out how we can help you to change the way you think, trade and perform.
Author

Chris Capre
2ndskiesforex
Chris Capre is a professional forex trader and mentor specialized in Price Action trading, and the Ichimoku Cloud.


