USDollar Breaks Below Distribution Pattern on Weekly

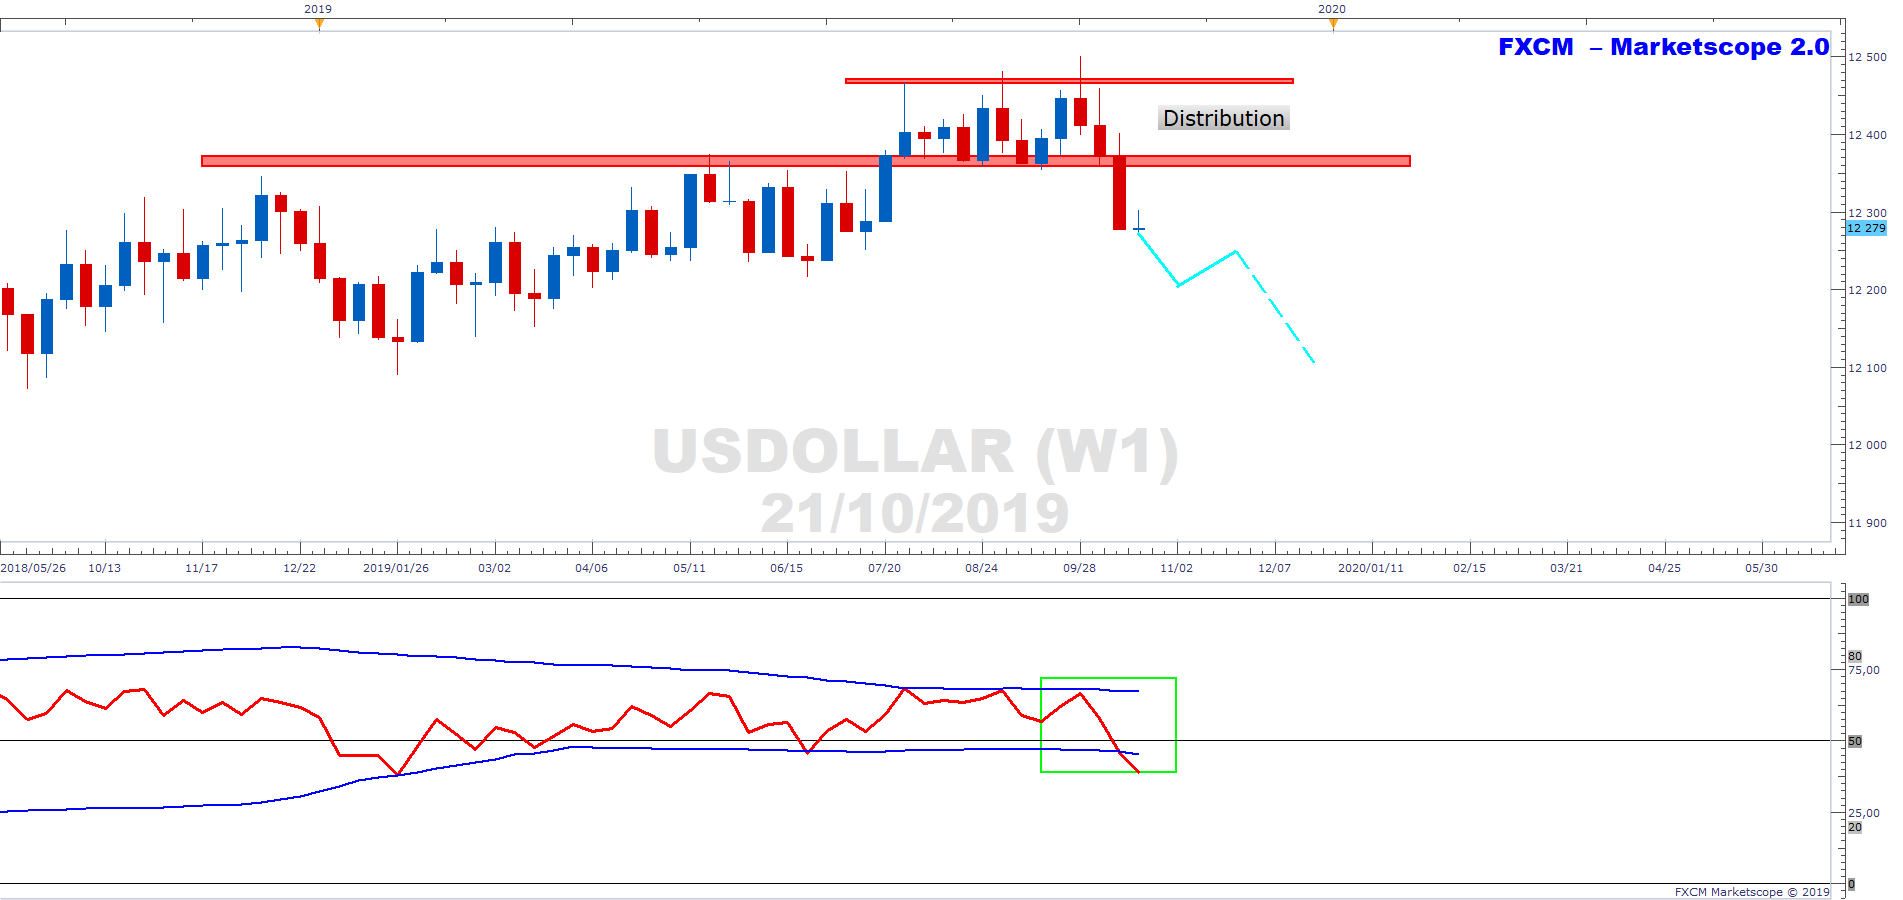
The below is the weekly chart of the USDOLLAR. The index broke through support last week. This is significant in that is seems that the consolidation pattern that has characterised the greenback over the last 3 months or so has been distributive in nature. We note that the RSI has dropped to the bearish side of 50 (green rectangle). The last 3 weeks in particular have been very bearish for the USD. This is due to a GBP repricing but also due to poor economic data such as the ISM manufacturing print, ISM non-manufacturing print, low wage growth, inflation not at target level and poor retail sales. Thus, a 25bps cut on 30 Oct is a very real possibility (and maybe another in December), with the buck is repricing. We continue to monitor.
Past performance is not an indicator of future results.
CHART SOURCE: FXCM MARKETSCOPE 2.0
Author

Russell Shor (MSTA, CFTe, MFTA) has an Honours Degree in Economics from the University of South Africa and holds the coveted Certified Financial Technician and Master of Financial Technical Analysis qualifications from the Interna


