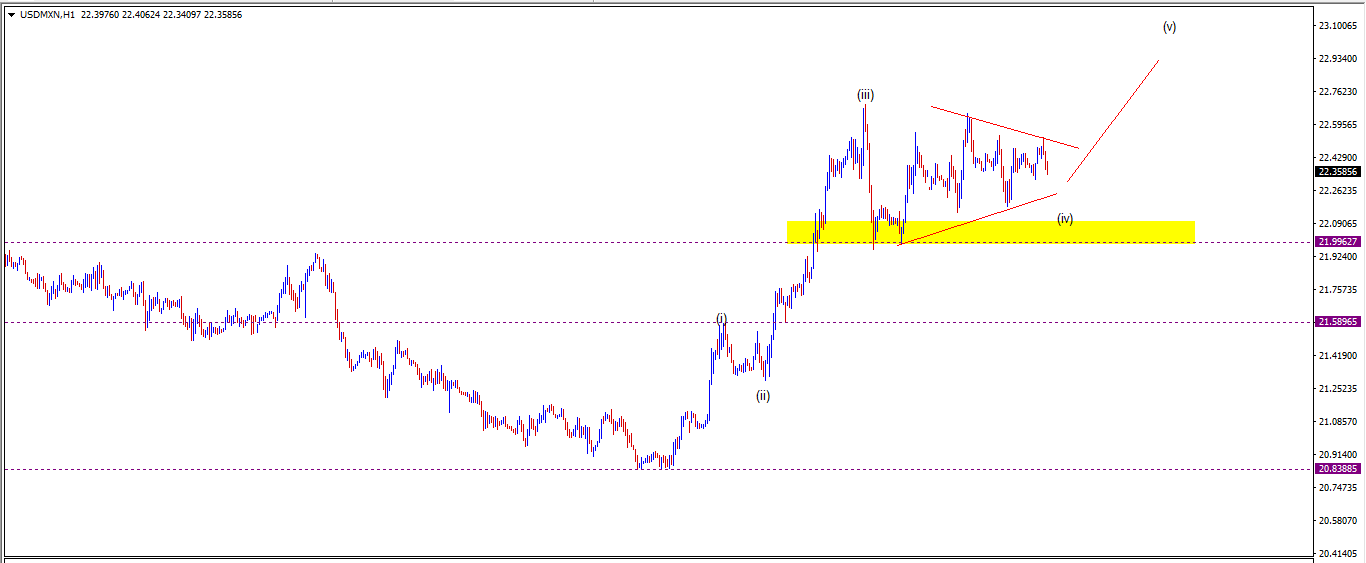
USD/MXN possible triangle break

The chart below shows USDMXN in a bullish impulse move on the one-hour timeframe. The current corrective move has been labelled as a triangle the most likely pattern at this point. The move has been sideways consuming time more than the price which is a key characteristic of a correction and triangle.
We currently have wave iv as a triangle, and we are now excepting a move higher to complete wave v. However, this can still be a wxy or an abc correction which could break lower. Triangles only appear in wave x, b or iv position. However, we must be careful and be- prepared for both outcomes, lower or higher. A break of 21.58960 will invalidate our bullish count.
No key news events to look out for this week for the Mexican Peso.
Res: 22.65194; 23.00000; 23.27407
Sup: 21.99627; 21.58965; 20.83885
Author

Mthokozisi Mpofu
Knars Capital
Mthokozisi Mpofu is the Managing Director of Knars Capital Pvt Ltd, an investment advisory firm helping African SMEs secure growth capital and become investor-ready.


