USD/JPY's EMAs Move into Bullish Stack on Daily Time

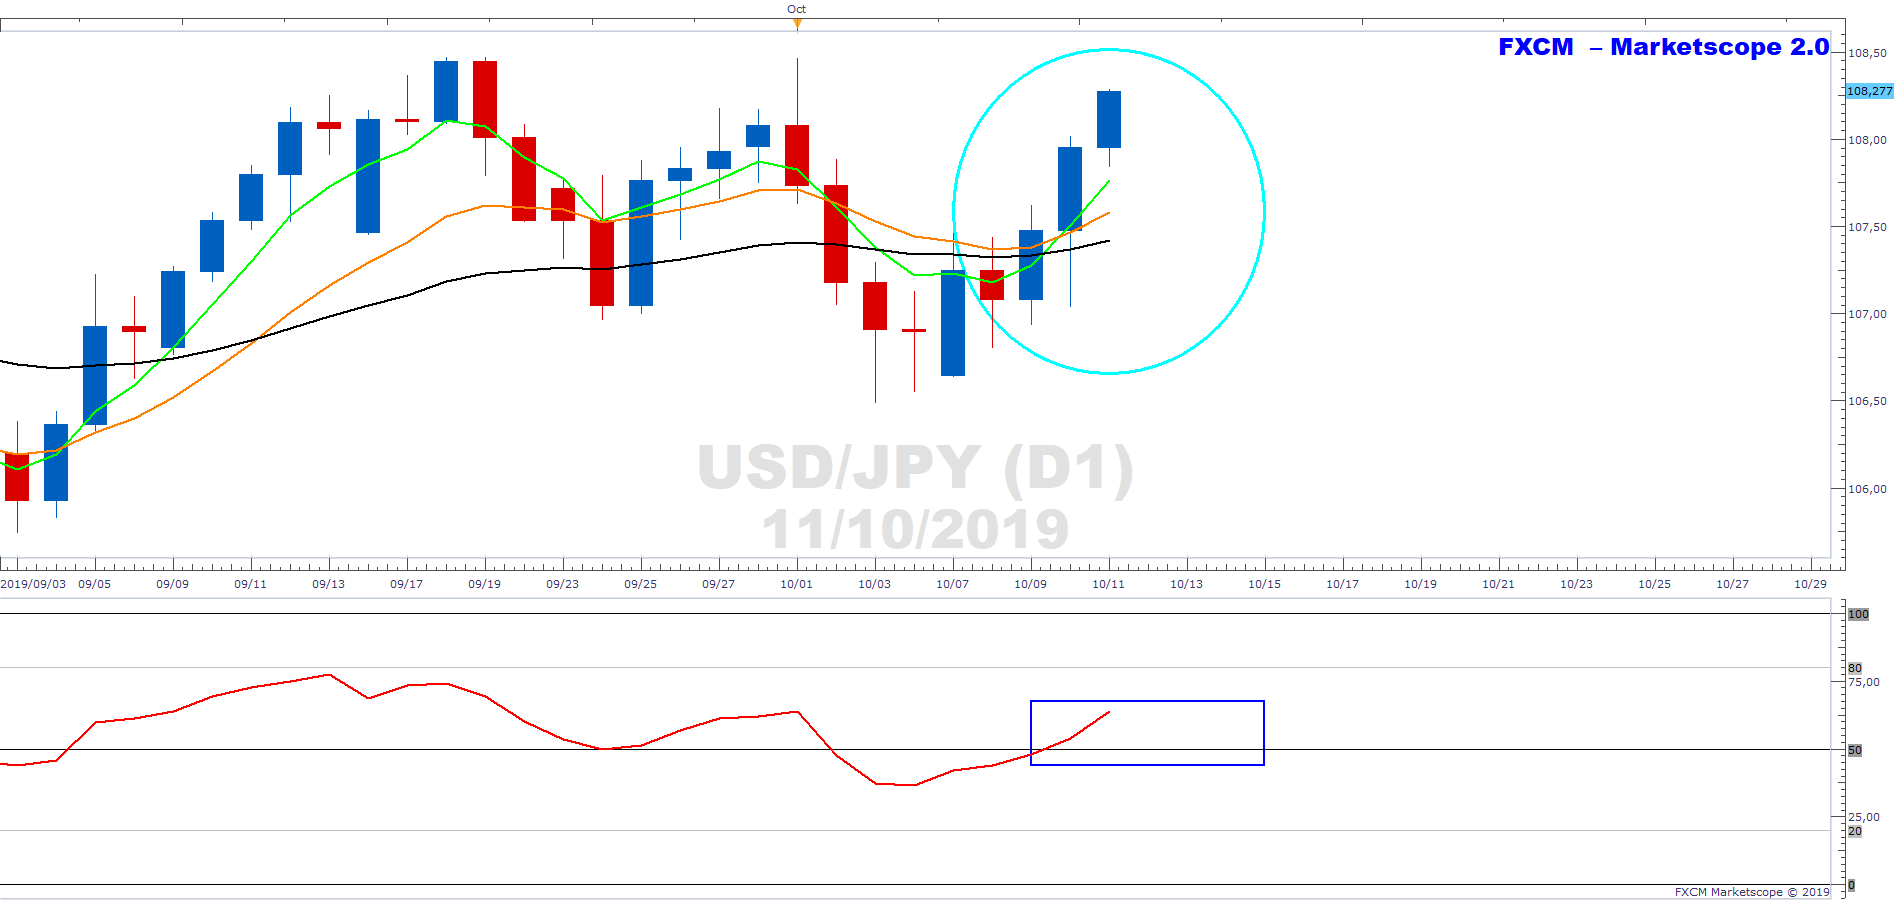
The below is the daily chart of the USD/JPY. The currency pair’s EMA’s have moved into a bullish stack. I.e. the green 5-day EMA is above the orange 10-day EMA, and the orange 10-day EMA is above the black 34-day EMA (aqua ellipse). The EMAs are starting to show angle and separation. Moreover, the RSI has moved above 50 and is indicative of an underlying bullish momentum. We continue to monitor.
Past performance is not an indicator of future results.
CHART SOURCE: FXCM MARKET SCOPE 2.0
Author

Russell Shor (MSTA, CFTe, MFTA) has an Honours Degree in Economics from the University of South Africa and holds the coveted Certified Financial Technician and Master of Financial Technical Analysis qualifications from the Interna
More from Russell Shor, CFTe, MFTA


