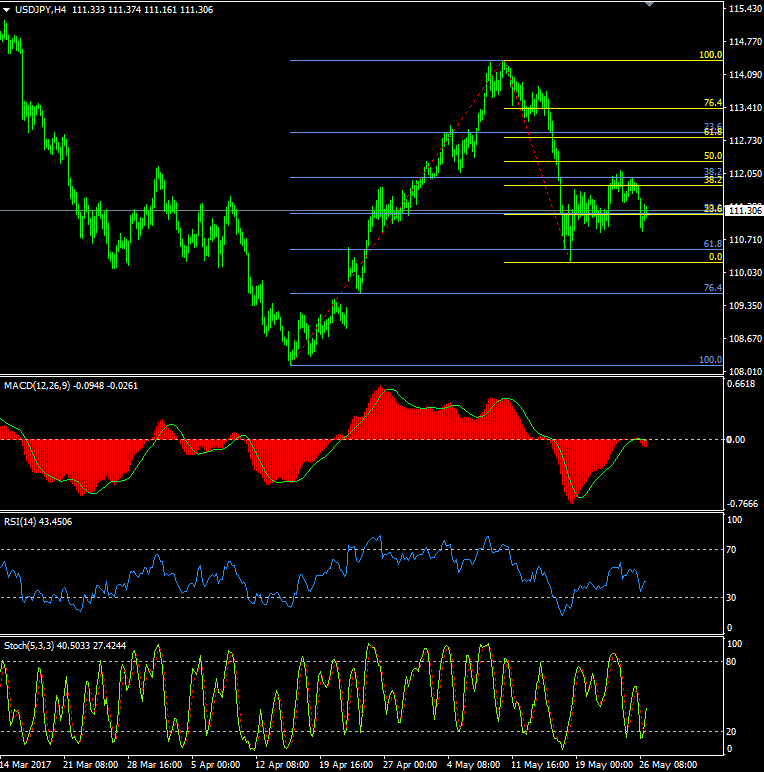
USDJPY: The 4 hour charts are neutral

US$Jpy saw a slide to 110.87 on Friday, but well supported by buyers at the previous lows around 110.85, the pair recovered to finish the week at 111.30.
The momentum indicators are mixed/neutral again at the start of the week and another choppy, rangebound session, largely confined to the 111/112 area would not surprise. While the dailies remain rather negative the hourly charts may be hinting at a mild squeeze to the topside, and further short term gains could see another move towards Friday’s high of 111.84 and then to 112.00/10, which would appear to be toppish for Monday if we get there. Beyond that though leads to 112.30 and then to 112.75, which might be a decent sell area if we ever get there.
On the downside, below 111.00 would lead back to 110.85, which should be strong, and 110.60, ahead of last Thursday’s low of 110.23. The 4 hour charts are neutral; me too. There are better things to trade while the Yen is chopping around like this.

Economic data highlights will include:
M:
T: Unemployment, Retail Trade
W: Housing Starts, Construction Orders
T: Foreign Bond/Stocks Investment, Nikkei Mfg PMI
F:
Author

Jim Langlands
FX Charts
Jim Langlands began his trading career in the commodities markets in London in 1976, before moving to Australia in 1979 to work as a floor trader on the Sydney Futures Exchange.


