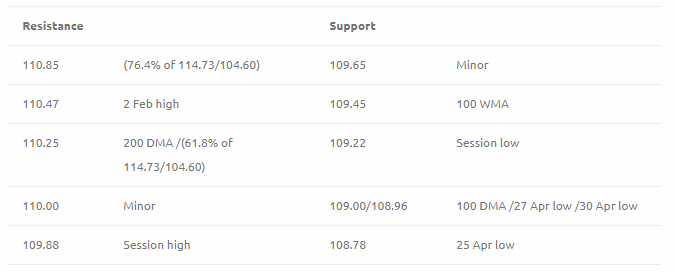
US$Jpy has ground higher, to reach 109.88, on the back of the dollar strength seen in the other major pairs, taking out the important 109.45/65 level in the process, and now seemingly has 110.00+ in its sights.
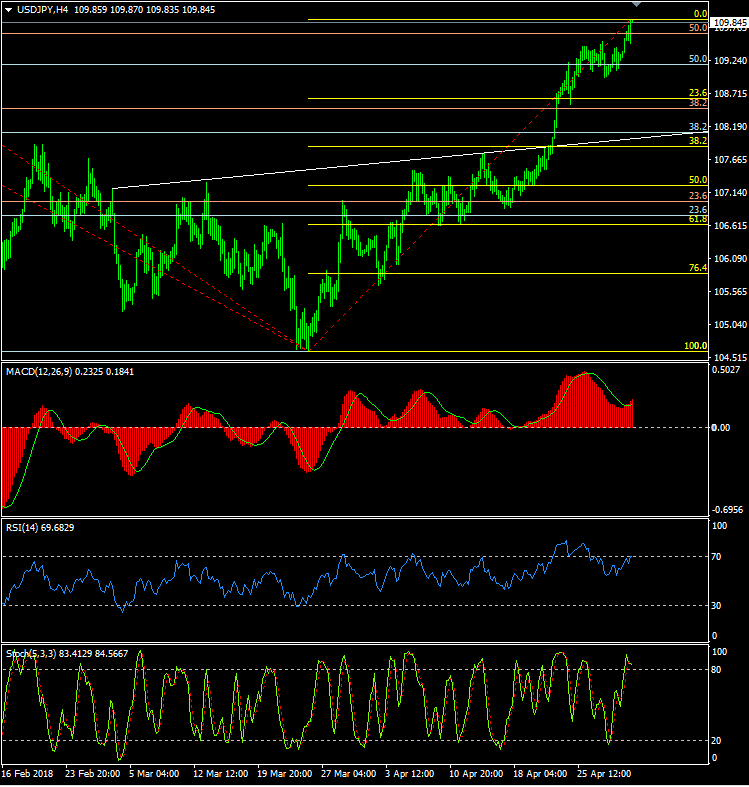
1 hour/4 hour indicators: Mixed.
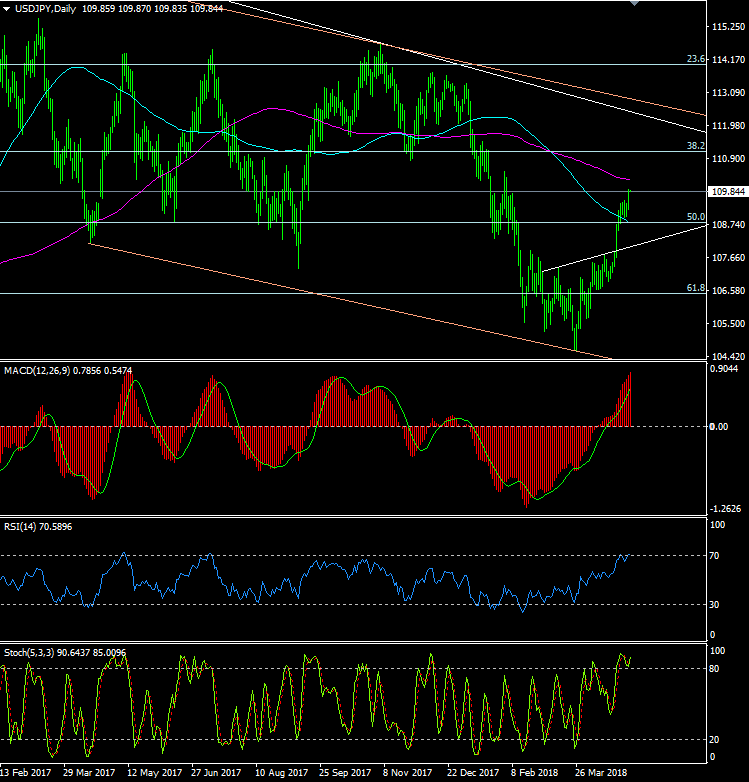
Daily Indicators: Up
Weekly Indicators: Turning higher
Preferred Strategy: US$Jpy seems likely to trade a narrow range ahead of the FOMC Meeting later in the day, but as before, with the longer term charts looking positive, a test of 110.00 seems to be on the cards. If so, look for a test of 110.25, which should be strong, ahead of 110.50 and 110.85. Note that the reverse SHS formation, with the neckline at 107.85, suggests a target at somewhere near 110.70.
The short term charts look a little mixed, possibly allowing for a dip, and on the downside, buyers will be seen today at 109.45/50, which previously acted as a cap, which should be reasonable support, below which could see a run back to the session low of 109.22, and then to 109.00. Trading from the long side is again preferred; today looking for dips towards 109.45/50, with a SL placed under 109.00
Buy US$Jpy @ 109.50. SL @ 108.95, TP @ 110.65
Japan Services PMI
All content on this website, www.fxcharts.com.au (FX Charts PL) is a personal view only and offers absolutely no guarantee as to the correctness or otherwise of that opinion. The content here is of a “general nature” only and does not constitute personal or investment advice. The FX Charts website is not an inducement to trade Foreign Exchange (FX). No liability whatsoever is accepted for any loss or damage that may result, directly or indirectly, from any , comment, opinion, information or omission, whether negligent or otherwise, within the FX Charts Website. The information and any opinion or outlook expressed in this commentary may be based on assumptions or market conditions and may be liable change at any time, without notice.
Recommended Content
Editors’ Picks
AUD/USD could extend the recovery to 0.6500 and above
The enhanced risk appetite and the weakening of the Greenback enabled AUD/USD to build on the promising start to the week and trade closer to the key barrier at 0.6500 the figure ahead of key inflation figures in Australia.
EUR/USD now refocuses on the 200-day SMA
EUR/USD extended its positive momentum and rose above the 1.0700 yardstick, driven by the intense PMI-led retracement in the US Dollar as well as a prevailing risk-friendly environment in the FX universe.
Gold struggles around $2,325 despite broad US Dollar’s weakness
Gold reversed its direction and rose to the $2,320 area, erasing a large portion of its daily losses in the process. The benchmark 10-year US Treasury bond yield stays in the red below 4.6% following the weak US PMI data and supports XAU/USD.
Bitcoin price makes run for previous cycle highs as Morgan Stanley pushes BTC ETF exposure
Bitcoin (BTC) price strength continues to grow, three days after the fourth halving. Optimism continues to abound in the market as Bitcoiners envision a reclamation of previous cycle highs.
US versus the Eurozone: Inflation divergence causes monetary desynchronization
Historically there is a very close correlation between changes in US Treasury yields and German Bund yields. This is relevant at the current juncture, considering that the recent hawkish twist in the tone of the Federal Reserve might continue to push US long-term interest rates higher and put upward pressure on bond yields in the Eurozone.