USD/JPY out of a bearish triangle – Elliott wave analysis

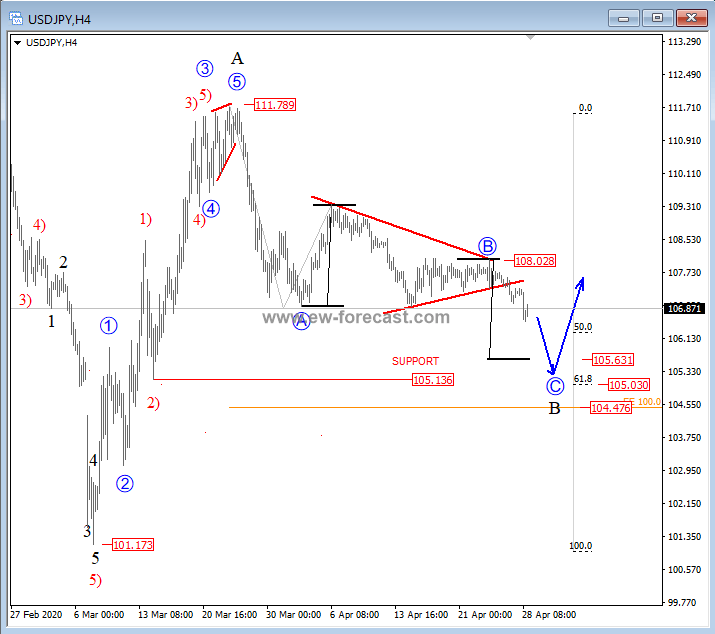
Hello traders, USDJPY started falling out of an Elliott wave triangle as seen on the 4h chart, down from 108.03 level, and breached the lower triangle line. As such, we are now tracking a five-wave structure into a wave C of B, which can look for a bullish turn at the 105.6/104.47 zone, where various Fib. ratios (50.0/61.8), and also former swing lows (2)) can react as support. That said, once a five-wave structure in C is visible, and we see a new rally to the upside, that is when first evidences of a low will be seen, and further upside will be expected.
USDJPY, 4h
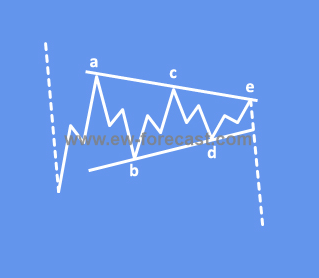
A Triangle is a common 5-wave pattern labeled A-B-C-D-E that moves counter-trend and is corrective in nature. Triangles move within two channel lines drawn from waves A to E, and from waves B to D. A Triangle is either contracting or expanding depending on whether the channel lines are converging or expanding. Triangles are overlapping five wave affairs that subdivide 3-3-3-3-3.
Triangles can occur in wave 4, wave B, wave X position or in some very rare cases also in wave Y of a combination.
An example of a bearish triangle:
Trade well,
The EW-forecast team
We realize that markets are very volatile and unstable these days. That is why we decided to give out a Special Discount to New and OLD members; Save 50% on Any FX or Digital Package. Visit EW-Forecast.
Author

Gregor Horvat
Wavetraders
Experience Grega is based in Slovenia and has been in the Forex market since 2003.


