USDJPY jumps off of S1 pivot support and power ahead

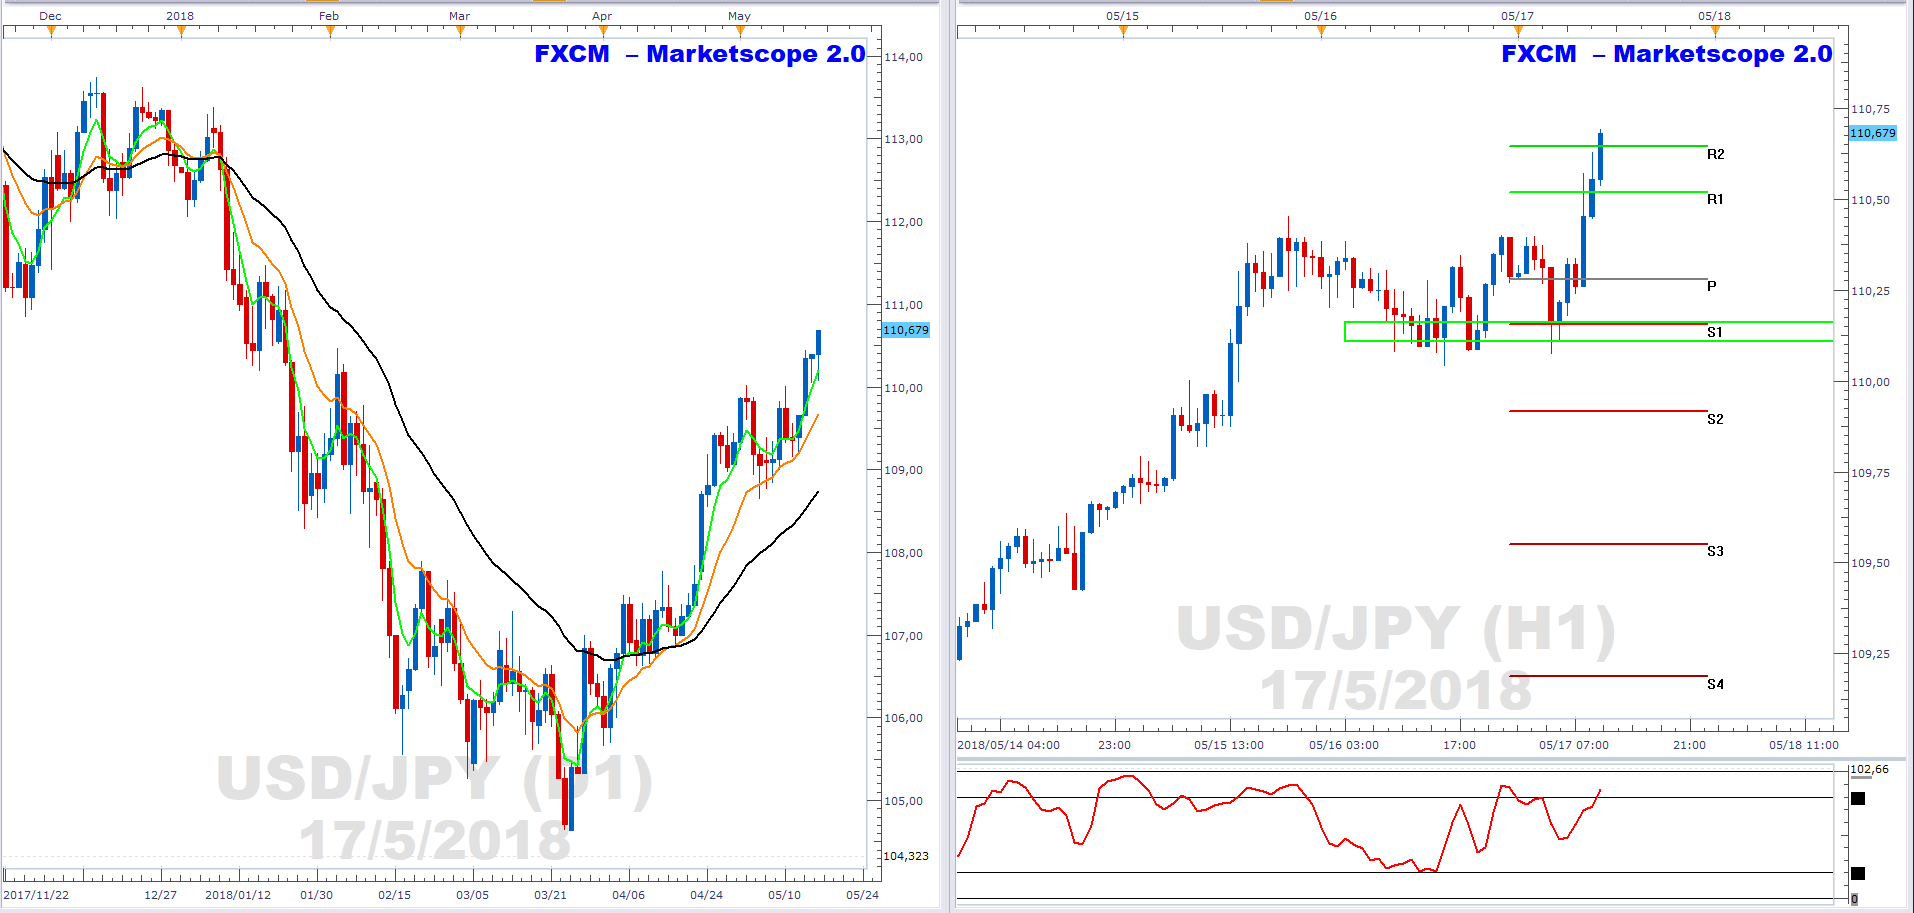
The left chart shows USDJPY daily price action. As can be seen it is in mark-up phase. This is characterised by a bullish EMA formation. I.e. the green 5-day EMA is above the orange 13-day EMA, and the orange 13-day EMA is above the black 34-day EMA.
The right chart shows hourly price action. Price found support at a key level with a confluence of factors including, S1 pivot support and price support (green rectangle).
The mark-up phase coincides with strong USD demand and an ultra-dovish policy by the BoJ. The US 10-yr is also attracting USDs as its spread with the Japanese 10-yr increases, making the carry trade more desirable.
Author

Russell Shor (MSTA, CFTe, MFTA) has an Honours Degree in Economics from the University of South Africa and holds the coveted Certified Financial Technician and Master of Financial Technical Analysis qualifications from the Interna


