USDJPY forecasting the rally after Elliott Wave zig zag pattern

Hello fellow traders. In this technical blog we’re going to take a quick look at the Elliott Wave charts of USDJPY , published in members area of the website. As our members know the pair is showing impulsive bullish sequences in the cycle from the January low. Consquently, we were calling for the further rally. Recently USDJPY made a pull back that has had a form of Elliott Wave Zig Zag pattern. We expected the pair to find buyers at the extreme zone from the 08/16 peak.
In the further text we are going to explain the Elliott Wave Pattern and the forecast Before we take a look at the real market example, let’s explain Elliott Wave Zigzag.
Elliott Wave Zigzag is the most popular corrective pattern in Elliott Wave theory . It’s made of 3 swings which have 5-3-5 inner structure. Inner swings are labeled as A,B,C where A =5 waves, B=3 waves and C=5 waves. That means A and C can be either impulsive waves or diagonals. (Leading Diagonal in case of wave A or Ending in case of wave C) . Waves A and C must meet all conditions of being 5 wave structure, such as: having RSI divergency between wave subdivisions, ideal Fibonacci extensions and ideal retracements.
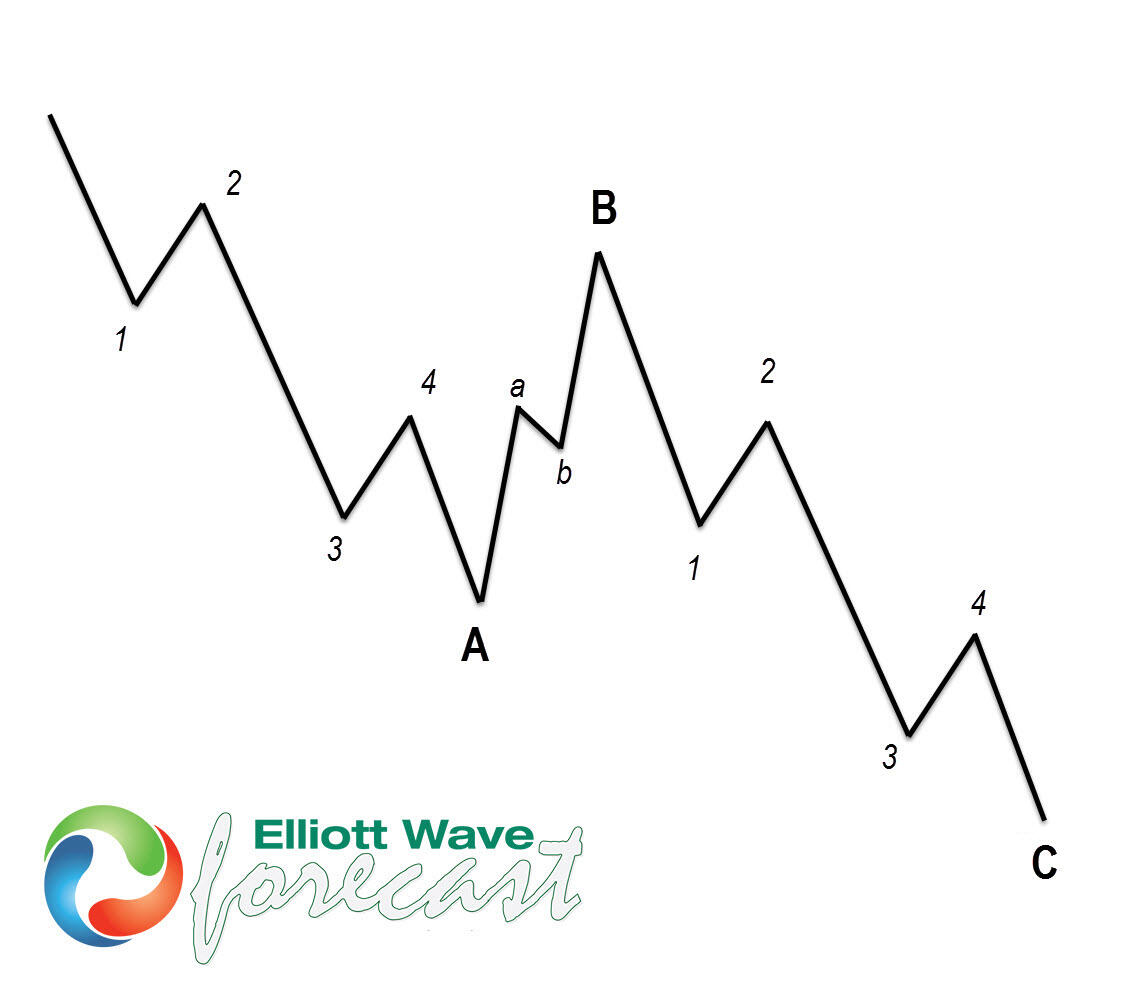
At the chart below we can see what Elliott Wave Zig Zag pattern looks like in real market.
USDJPY H1 London Update 08.23.2023
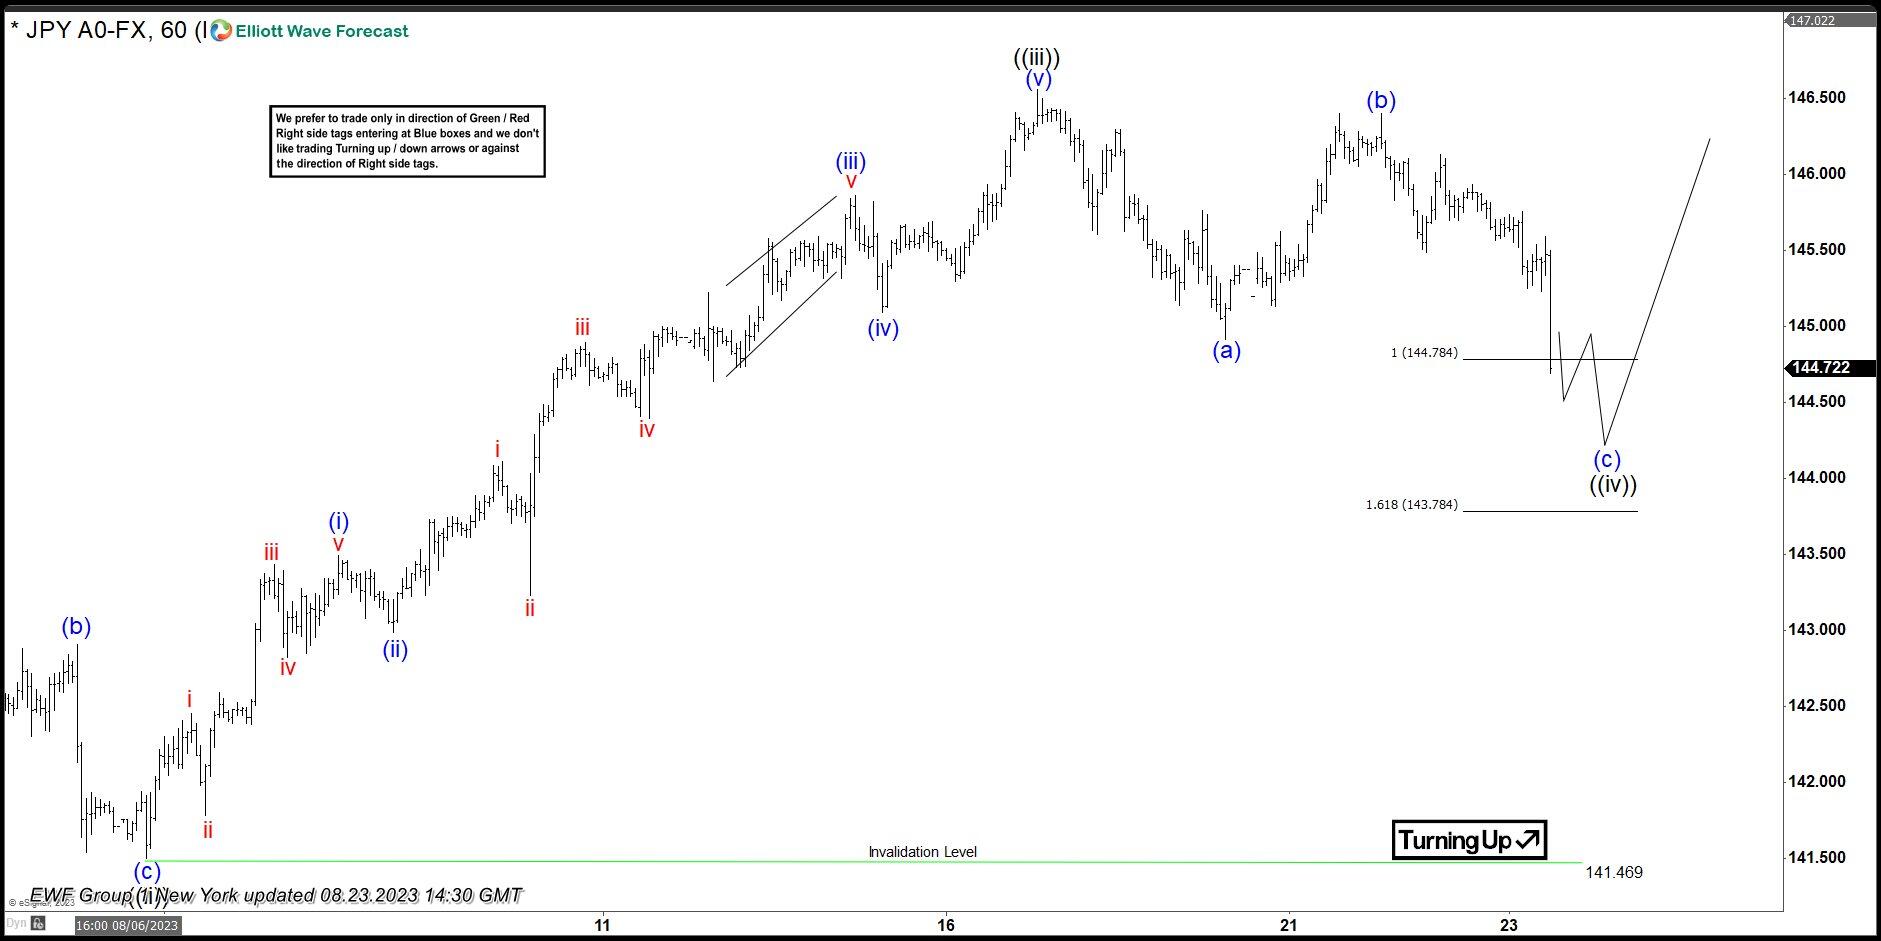
USDJPY is giving us pull back against the 141.469 low. First leg has a form of 5 waves, so we assume pull back is unfolding as Elliott Wave Zig Zag Pattern. That means both (a) and (c) legs should have 5 waves . There is already enough number of swings to complete the pull back. Equal legs area is reached at 144.78-143.78 ( buyers zone). However until we get decent reaction, we are aware that pull back can extend within proposed area. We don’t recommend selling the pair and expect further rally to resume from the buyers zone.
USDJPY H1 London Update 08.25.2023
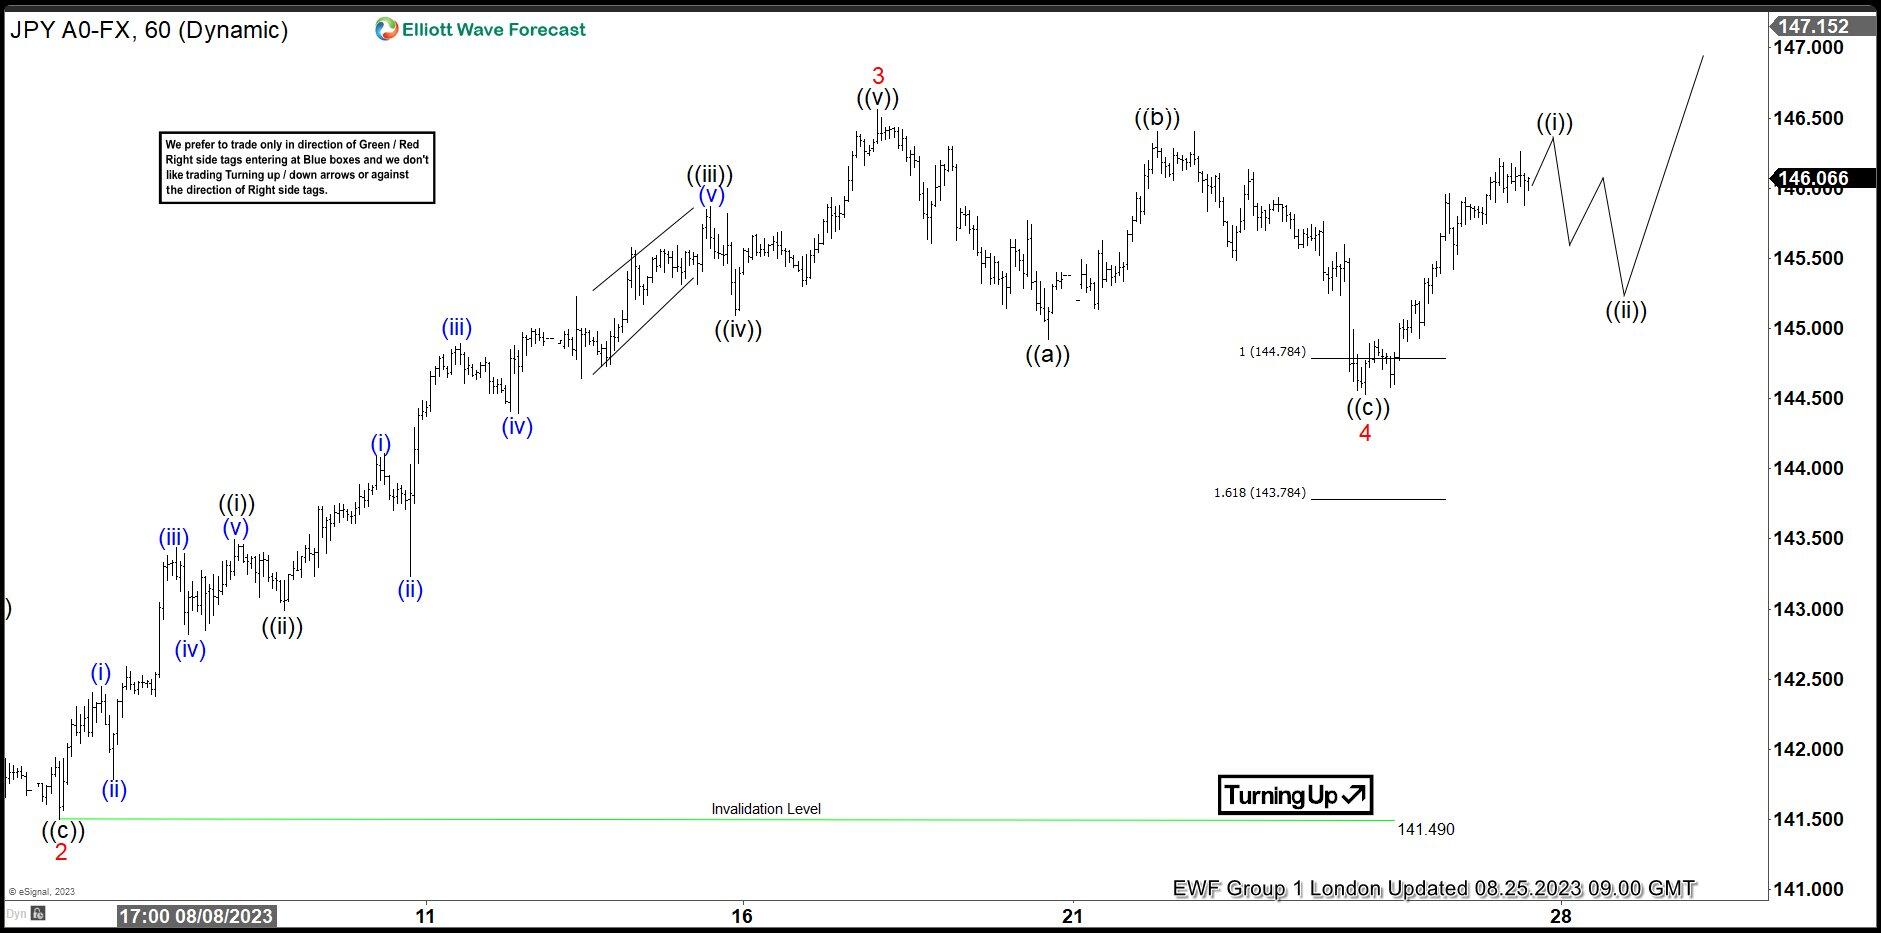
The pair has given us nice reaction from the marked zone and we count 4 red red pull back completed at 144.54 low. Now, as far as the price holds above that low we expect to see further extension higher and break above 3 red high : 08/16 to confirm next leg up is in progress. Short term we are about to end 5 waves up from the 144.54 low and then we can see a intraday pull back ((ii)) black. Once the pull back completes, next technical area to the upside should ideally come at 147.026-147.794.
Keep in mind that market is dynamic and presented view could have changed in the mean time. You can check most recent updates in the membership area of the website. Remember that not every chart is trading recommendation.
Author

Elliott Wave Forecast Team
ElliottWave-Forecast.com


