USDCHF – Potential LT Trend Reversal (Daily chart)

Price Action Context
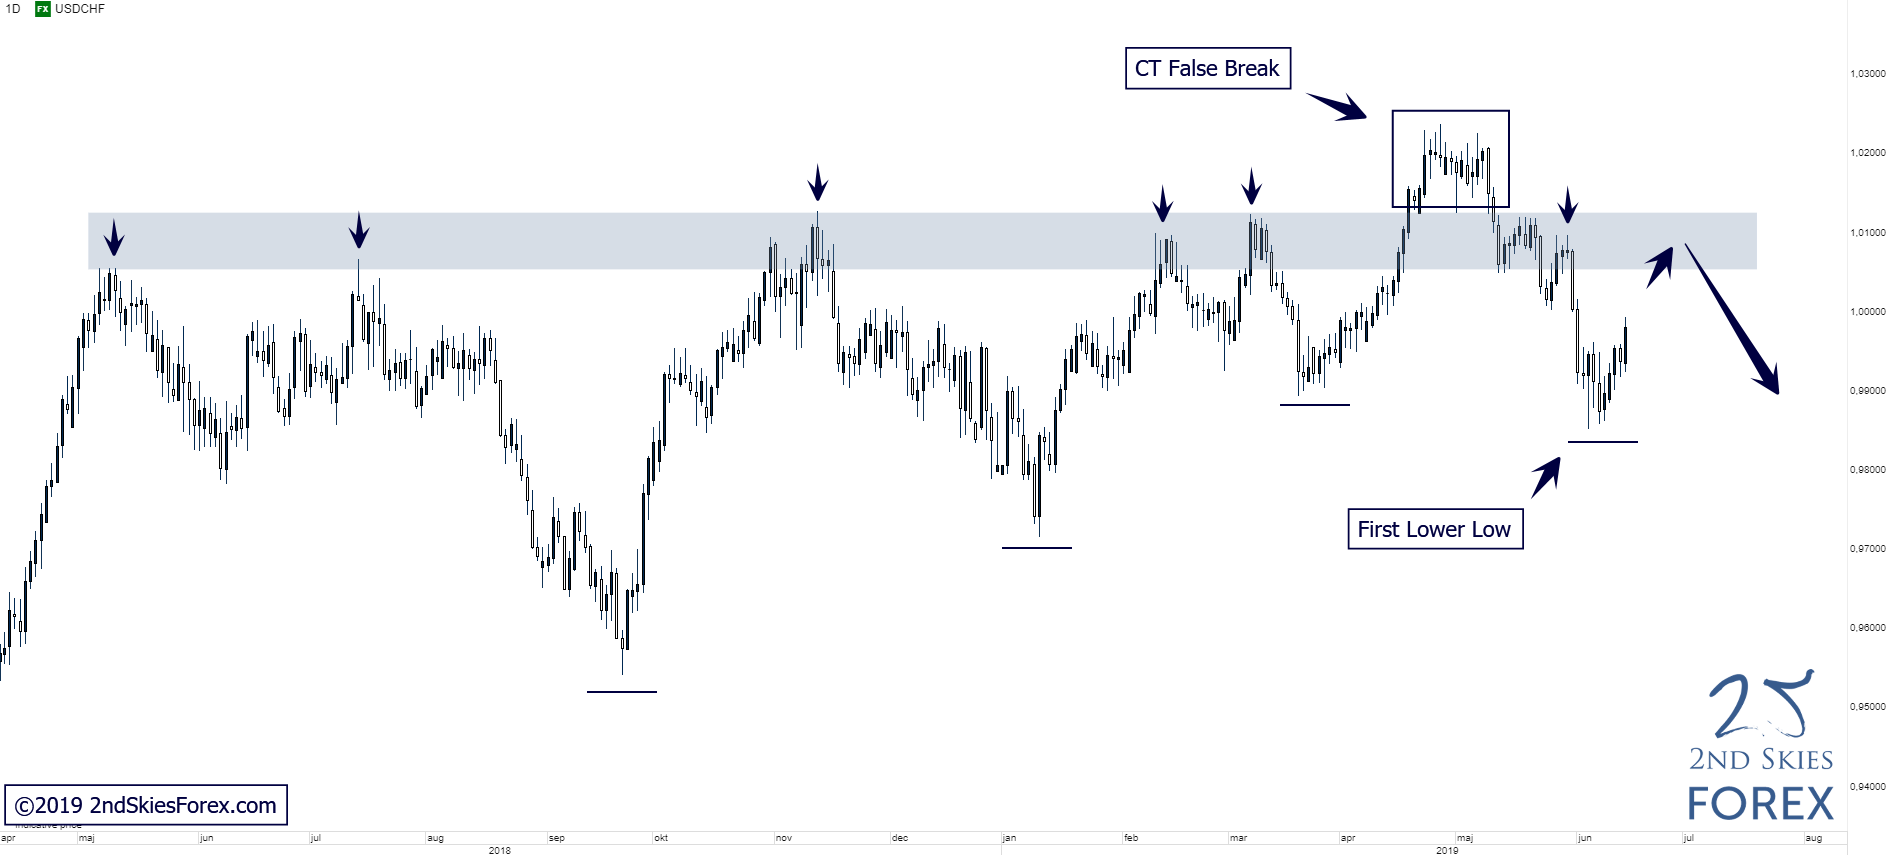
After putting in a CT FB at the LT resistance we’ve talked about in earlier commentaries, bears stayed in control, pushed price lower all the way to 0.9850. This created the first lower low after a series of higher highs since early 2018, which indicates that the LT bull trend potentially is coming to an end and we might be looking at a LT transition in order flow from bullish to bearish.
Trending Analysis
LT bias is neutral and a possible pullback into the LT resistance can offer potential shorting opportunities to bears.
Key Support & Resistance Zones
R: 1.0050 – 1.0130
S: 0.9780 – 0.9825
Visit our website at 2ndSkies for more price action content, free trading lessons, strategies and videos. Find out how we can help you to change the way you think, trade and perform.
Author

Chris Capre
2ndskiesforex
Chris Capre is a professional forex trader and mentor specialized in Price Action trading, and the Ichimoku Cloud.


